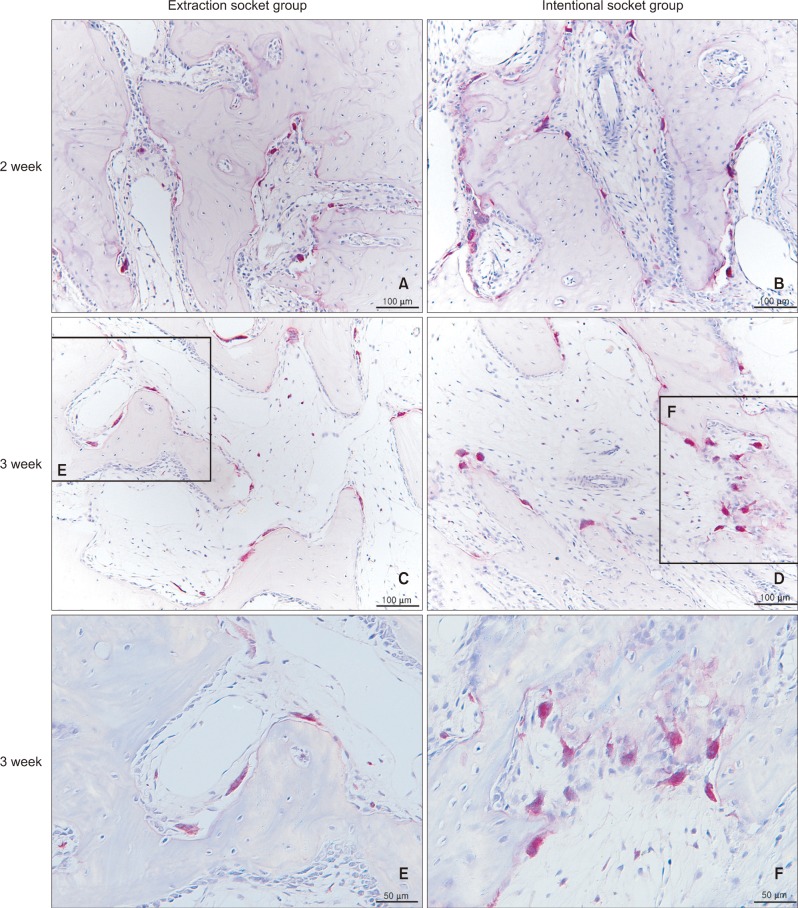
Figure 6.
Microphotograph of periodontal tissues with tartrate-resistant acid phosphatase (TRAP) staining. A, C, and E, Extraction socket group; B, D, and F, intentional socket group. A and B are week 2 specimens, while C, D, E, and F are week 3 specimens. TRAP-positive cells can be observed on the compression side along the resorbed surface of the alveolar bone. The intentional socket group shows several clusters of TRAP-positive cells, while the extraction socket group forms a straight band. There were no significant differences in the TRAP-positive cells/area between the 2 groups.

