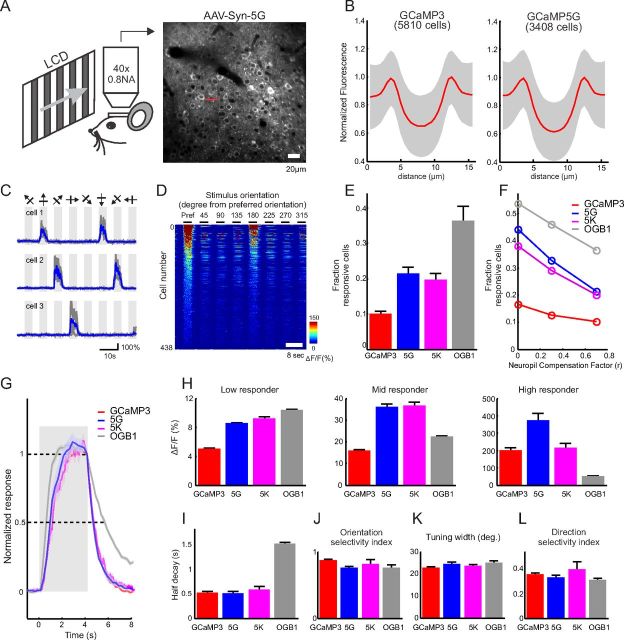
Figure 8.
Comparing 5G and 5K with GCaMP3 and OGB-1 in mouse visual cortex. A, Left, Schematic showing experimental setup. Right, GCaMP5G expression in layer 2/3 neurons of V1 3 weeks following AAV injection. B, Normalized fluorescence intensity along a line through the center of a cell (red line in A, right). Mean in red and standard deviation in gray. C, Responses of three cells to eight oriented moving grating stimuli; gray, single trials, blue, trial-average. D, Visual responses ((ΔF/F)max) of 438 responsive cells, rank ordered by signal level, to eight orientations aligned in columns starting with the preferred orientation. E, Fraction of visually responsive neurons (GCaMP3, 10.2%; 5G, 21.5%; 5K, 20.6%; OGB-1, 36.5%; neuropil compensation factor r = 0.7). F, Fraction of responsive neurons as a function of the strength of neuropil compensation applied. G, Averaged visually evoked calcium transients of the 10% most responsive cells at their preferred orientations, normalized to the end of the stimulus period. H, Average ΔF/F at the preferred orientation for low responder (50–80th percentile), mid responder (80–97th percentile), and high responder (>97th percentile) cells. I, Fluorescence half-decay time after stimulus offset (quantified for the 10% most responsive cells at preferred orientation). GCaMP3 (520 ± 430 ms, median ± SD), 5G (510 ± 500 ms), 5K (570 ± 580 ms), OGB-1 (1510 ± 460 ms); p = 0.73 (3 vs 5G), 0.045 (3 vs 5K), 0.083 (5G vs 5K), (p < 10−23, GCaMPs vs OGB-1; Wilcoxon signed rank sum test). J, OSI. GCaMP3, 0.87 ± 0.05; 5G, 0.76 ± 0.06; 5K, 0.82 ± 0.11; OGB-1, 0.75 ± 0.08; ANOVA1, p = 0.03. K, Tuning width. GCaMP3, 23 ± 1; 5G, 25 ± 2; 5K, 24 ± 1; OGB-1, 25 ± 1; ANOVA1, p = 0.11. L, DSI. GCaMP3, 0.35 ± 0.03; 5G, 0.33 ± 0.04; 5K, 0.4 ± 0.1; OGB, 0.3 ± 0.02; ANOVA1, p = 0.15. Error bars indicate SEM.

