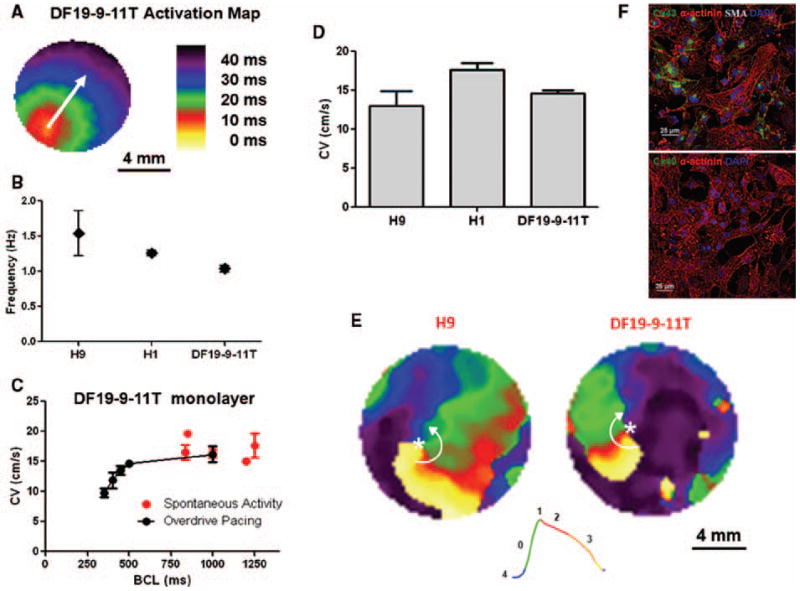
Figure 8. Optical mapping of transmembrane voltage from monolayer cultures of PSC-derived CMs.

(A) Activation map showing uniform action potential propagation across the monolayer. (B) Spontaneous activation rate for H9, H1, and the DF19-9-11T monolayers. The spontaneous activation rates were 1.54 ± 0.32 (H9, N=8), 1.26 ± 0.04 (H1, N=6), and 1.04 ±0.17 Hz (DF19-9-11T, N=13). (C) Spontaneous and average conduction velocities of the DF19-9-11T cell line measured as a function of pacing frequency (basic cycle length, BCL): Spontaneous (N=13); BCL 1000 (N=5); BCL 500 (N=5); BCL 450 (N =5); BCL 400 (N=5); BCL 350 (N=5). (D) Average conduction velocities for the H9 (N=3), H1 (N=6), and DF19-9-11T (N=5) monolayers measured at 2 Hz pacing. (E) Representative snapshots from phase movies showing electrical rotors in H9 and DF 19-9-11T CM monolayers. Green represents the depolarization phase of the propagating action potential, phase zero; red represents phase 2 or the plateau phase of the action potential; finally orange and yellow represent phase 3 repolarization of the action potential. The white asterisk indicates the phase singularity, the point where all phases of the action potential converge which is the organizing center of the arrhythmic reentry. The white arrows denote the direction of the rotation of the reentrant waves. (F) Immunolabeling of iPSC-CM monolayer (DF19-9-11T) for sacromeric protein α-actinin in combination with α-smooth muscle actin (SMA) and gap junction protein Cx43 and Cx40, respectively. Note abundant staining for α-actinin and Cx43 but no staining for SMA or Cx40. Scale bars are 25 μm. Error bars where shown represent SEM.
