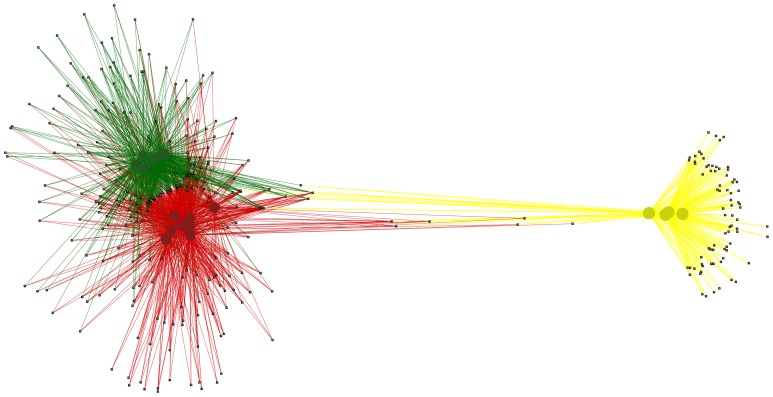
Figure 2. Network analysis of OTUs present in PM, PM-fed chickens and control chickens.
PM-fed chickens (large red circles) and control chickens (large green circles) form distinct groups based on OTU (small black squares) abundance, although they still share many OTUs. PM (large yellow circles) was distinct from both groups of chickens. PM-fed chickens and PM shared six OTUs that were not present in control chickens. There were eight OTUs shared by all three groups. PM and control chickens shared only one OTU that was not present in PM-fed chickens.

