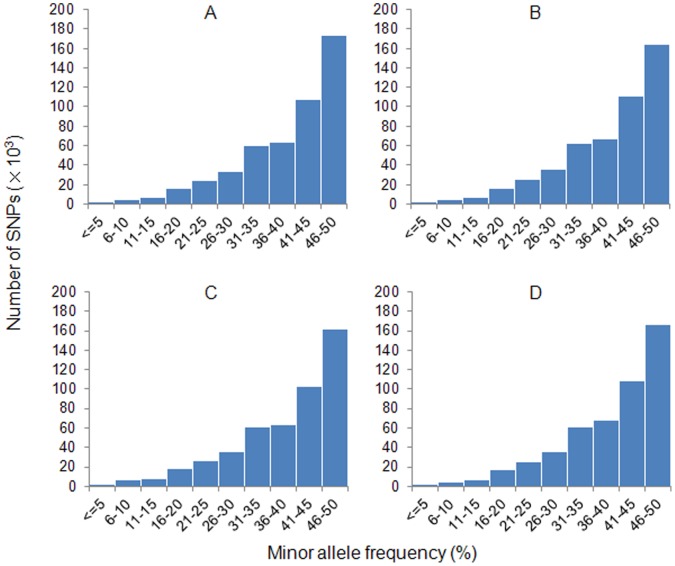
Figure 2. Distribution of minor allele frequencies of SNPs identified for four strains of common carp.
A: strain-specific SNPs in mirror carp; B: strain-specific SNPs in purse redcarp; C: strain-specific SNPs in Xingguo red carp; D: strain-specific SNPs in Yellow River carp. The X-axis represents the SNP sequence derived minor allele frequency in percentage, while the Y-axis represents the number of SNPs with given minor allele frequency.

