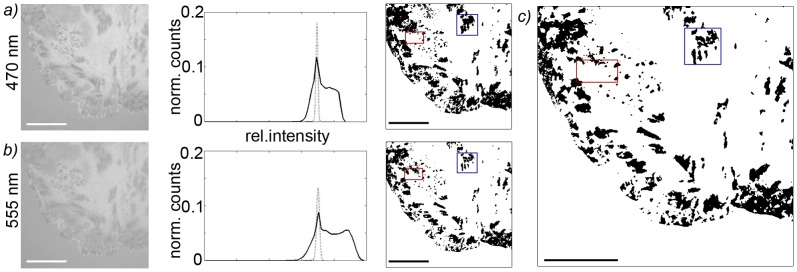
Figure 1. Analysis of DW-RICM images to determine the contact area of hepatocytes.
a) and b) show the RICM interferograms for the two different wavelengths used, the histogram of the background intensities (dotted line) and cell intensities (solid line) as well as the contact area determined from the use of the background intensity as a cutoff. For this, the mean intensity IB and standard deviation (σ) of the background were determined and all areas of at least 4×4 pixels with an intensity of less than (IB - σ/2) were defined as contact patches. In c) the consensus of the contact patches observed in the two different wavelengths corresponding to the contact area is shown with regions of high variability in the two wavelengths emphasized. Scale bars corresponds to 20 µm.

