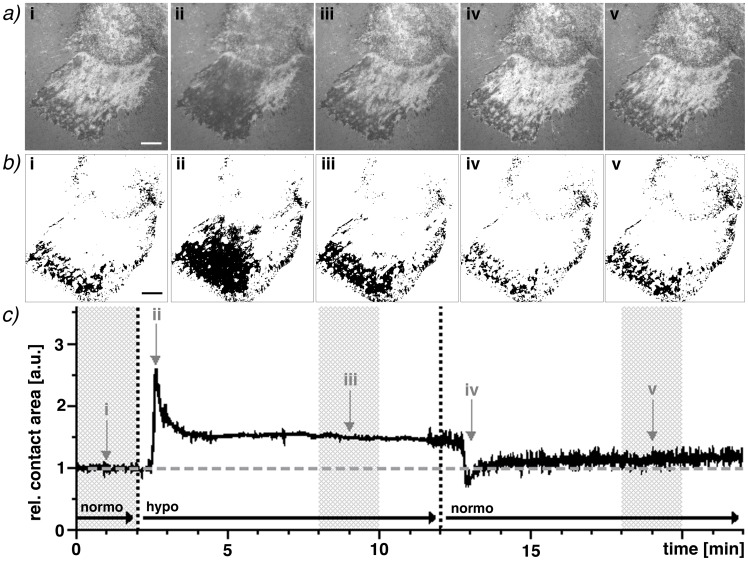
Figure 2. Determination of the changes in contact area during osmotic stimulation of adhered primary hepatocytes.
a) The dark patterns in the RICM image of two different wavelengths (470 nm shown here) correspond to cell patches with close surface contact. The original relative contact area (i) changes considerably during hypoosmotic stimulation (ii) and does not return to its original area afterwards (iii). A rapid decrease in relative contact area can be observed after returning to normoosmotic media (iv) followed by the stabilization of the relative contact area (v). b) All areas defined as relative contact areas in the consensus of both wavelengths are represented here as black areas. Images taken at 1 fps in both wavelength simultaneously enable a kinetic analysis: c) The tremendously quick reaction of the hepatocytes to the osmotic stimuli is evident as well as the stable plateaus (compared to the initial relative contact area (i)). The first plateau of this sample (iii) increases by ∼50% and the second (v) by ∼14%). Scale bars correspond to 10 µm.

