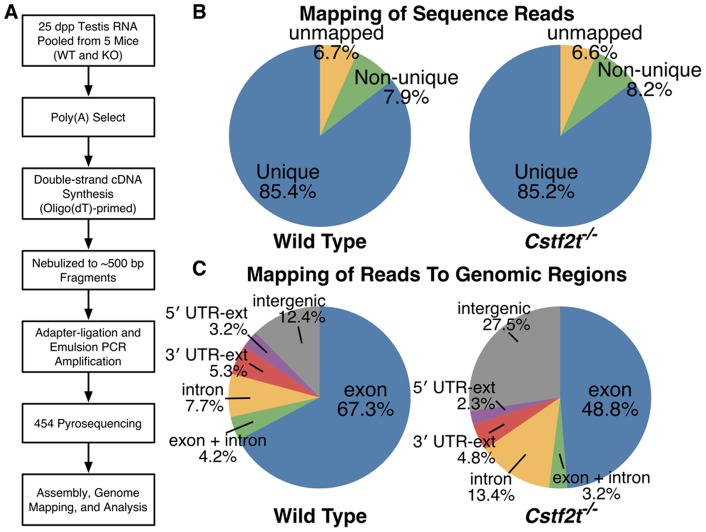
Figure 1. High-throughput cDNA sequencing (RNA-seq) finds significant differences between wild type and Cstf2t−/− mouse testis RNAs.
(A) RNA was pooled from testes of five 25 dpp mice of either wild type or Cstf2t−/− genotype, cDNA synthesized, and high-throughput sequencing performed (see Materials and Methods). (B) RNA-seq from wild type (∼55,000 reads) and Cstf2t−/− (∼77,000 reads) mouse testis samples were not biased when mapped to the mouse genome. 454 sequencing reads were mapped to the mouse genome (Mouse Genome Assembly version mm8) using BLAT [24]. Pie graphs show that similar proportions of reads mapped to either unique genomic regions (blue), multiple regions (non-unique, green), or could not be mapped to known regions (unmapped, tan) in samples from wild type or Cstf2t−/− mouse testes. The proportion of uniquely mapped reads has no statistical difference between wild type and Cstf2t−/− mice (85.4% vs. 85.2%; P = 0.14, Fisher's exact test). (C) Introns and intergenic regions were more highly expressed in testes of Cstf2t−/− mice, while exons were less expressed. Pie graphs show percentages of reads that were uniquely mapped to different regions of the genome for wild type and Cstf2t−/− mice. Exon (blue), reads fully aligned to exons; exon & intron (green), reads aligned to both exonic and intronic regions; intron (tan), reads fully aligned to introns; 3′ UTR-ext (orange) and 5′ UTR-ext (purple), reads aligned to within 4 kb downstream of 3′ UTR or 1 kb upstream of the 5′ UTR, respectively; intergenic (grey), reads aligned to regions not within annotated genes or their extended regions. The difference of proportion of reads mapped to different genomic regions is significant: P <10–323 for both the intergenic region and intronic region (Fisher's exact test, exon region used as control).

