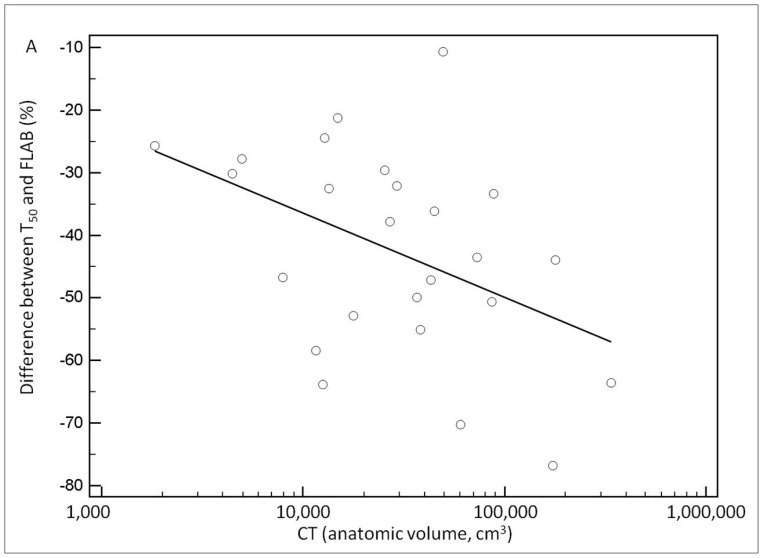
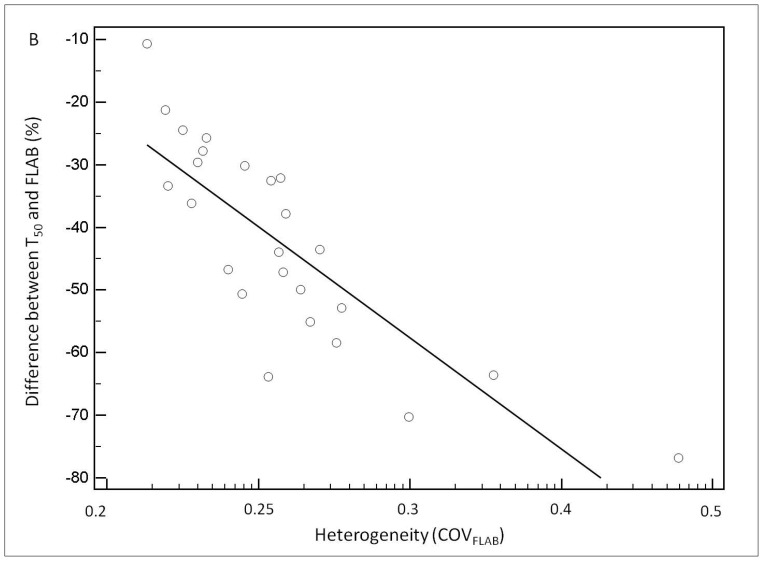
Figure 4.
white is for manual on CT, blue for T50, purple for A1 and green for FLAB. (A) small (<2cm in diameter) and (B,C) larger lesions with (B) moderate (COVFLAB=0.23) and (C) higher (COVFLAB=0.30) heterogeneity. For readability purposes, A1 contours are not shown in B–C and manual PET contours are not shown in B as they were similar to FLAB and T50.


