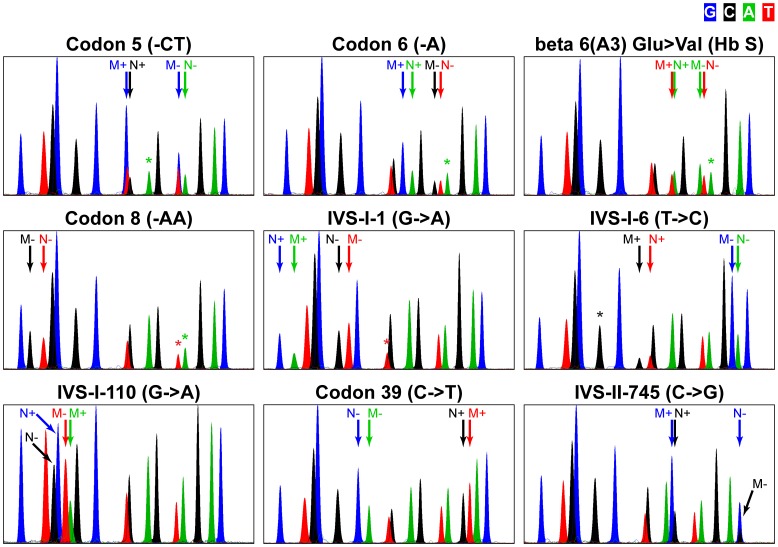
Figure 2. Single-nucleotide primer extension assay performance.
Analysis of DNA from heterozygous carriers of the assayed mutations, as indicated above the electropherograms. For each mutation, color-coded arrows denote normal and mutant genotype peaks. ‘+’ and ‘−’ indicate strand specificity of the primers; N+, normal peak generated from ‘+’ primer; M+, mutant peak generated from ‘+’ primer; N−, normal peak generated from ‘−’ primer; M−, mutant peak generated from ‘−’ primer. Asterisks mark peaks that are lower than normal due to interference from genetic variations within the primer-hybridizing template sequence.

