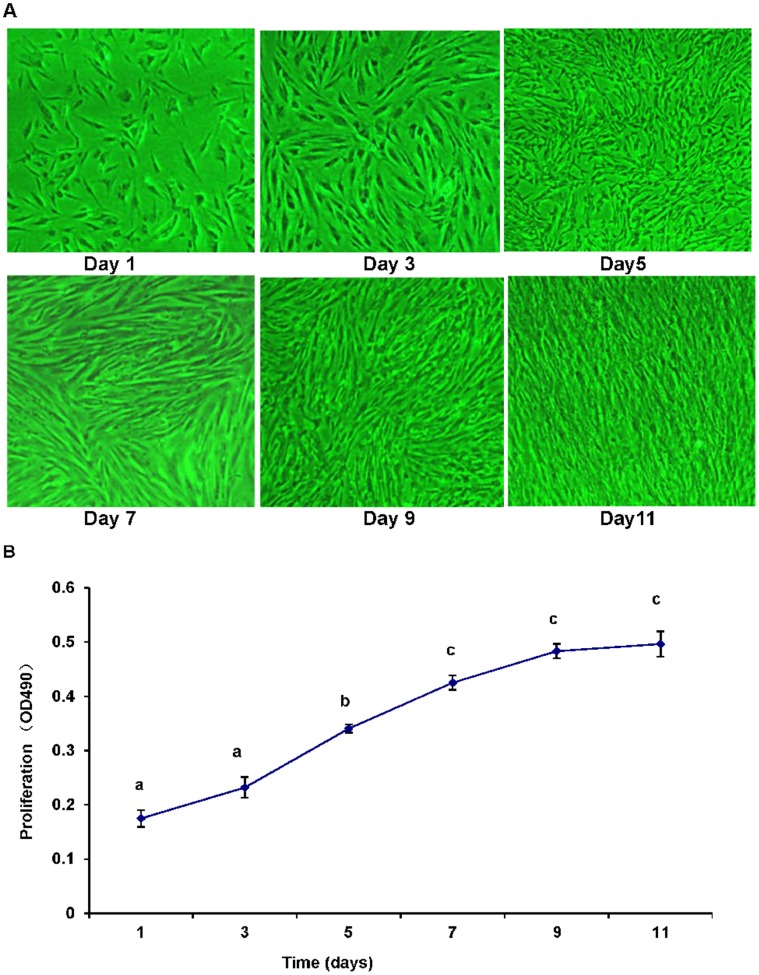
Figure 1. Growth of large yellow croaker preadipocytes isolated from adipose tissue at different days of growth.
(A) Photomicrographs of yellow croaker preadipocytes on day 1, 3, 5, 7, 9, and 11 (× 40). (B) Proliferation profile of preadipocytes on day 1, 3, 5, 7, 9, and 11. Data are means ± SEM, n = 8. Different letters indicate significant differences at P<0.05.

