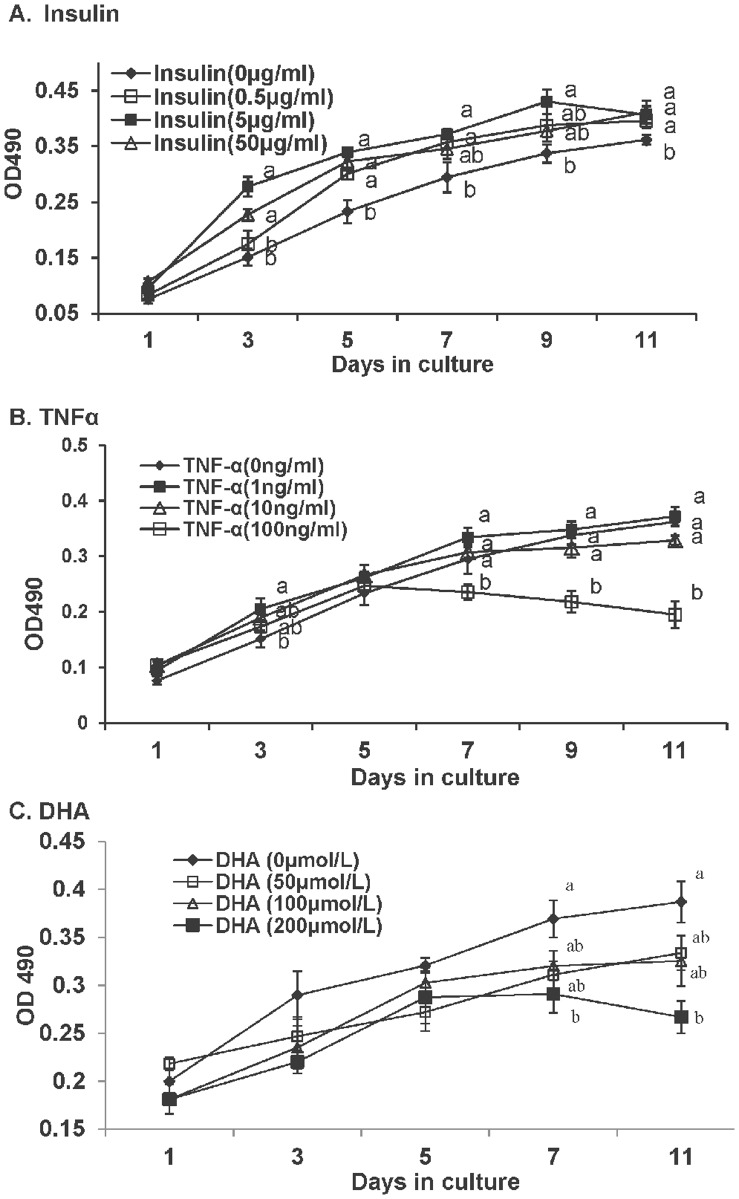
Figure 3. Proliferation profiles of large yellow croaker preadipocytes treated with (A) Insulin. (B) hrTNFα. (C) DHA. Cells was incubated with insulin at 0, 0.5, 5 and 50 µg/ml, TNFα at 0, 1, 10, 100 ng/ml, and DHA at 0, 50, 100 and 200 µmol/L, in separate wells from day 1 to day 11.
Cells cultured in growth medium without DHA or EPA were used as control. On days 1, 3, 5, 7, 9 and 11, the cells were treated with MTT and proliferation was analyzed. Data are means ± SEM, n = 8. Different letters indicate significant differences at P<0.05.

