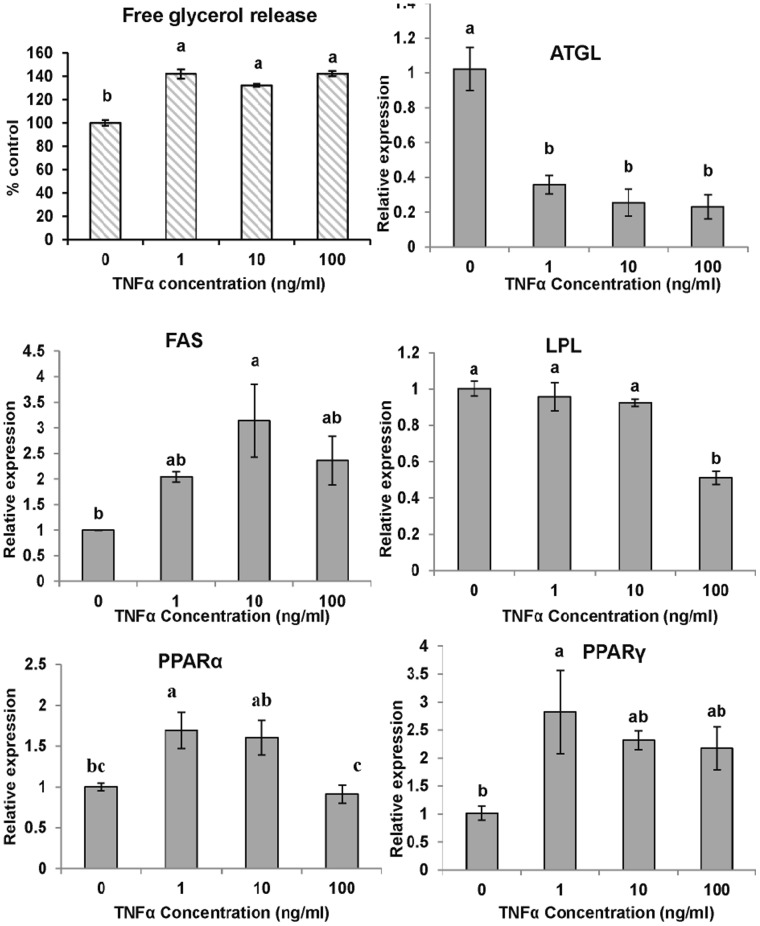
Figure 7. The effect of TNFα on glycerol release and gene expressions of large yellow croaker adipocytes during lipolysis.
The fully differentiated adipocytes were exposed to growth medium without FBS but supplemented with 0, 1, 10 or 100 ng/ml hrTNFα for 24 h before the determining the glycerol concentration in the medium. The gene expression levels were determined by quantitative Real-Time PCR. Data were analyzed by using 2−ΔΔCt [87] and are referred to the control treatment (TNFα = 0) using β-actin as a control. Data are means ± SEM, n = 3. Different letters indicate significant differences at P<0.05. ATGL = adipose triglyceride lipase, FAS = fatty acid synthase, LPL = lipoprotein lipase, PPAR = proliferators-activated receptor α, γ.

