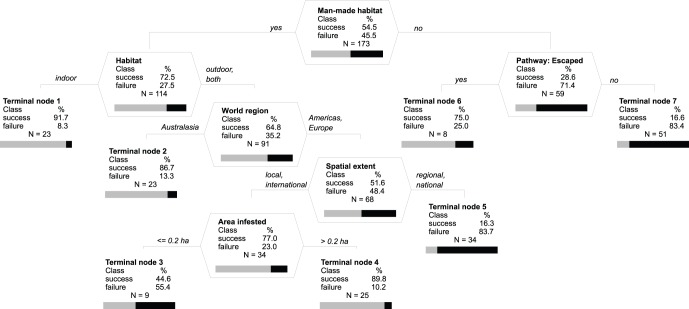
Figure 1. Optimal classification tree for factors relating to success and failure of 173 eradication campaigns against invertebrate plant pests, plant pathogens (viruses/viroids, bacteria and fungi) and weeds in a model without any predetermined structure.
Splitting nodes (polygonal tables with splitting variable name) and terminal nodes (with a split criterion above each) show a table with columns for the outcome (success/failure) and % of weighted cases for each outcome, total number of unweighted cases (N), and graphical representation of the percentage of success (grey) and failure (black) weighted cases (horizontal bar). Vertical depth of each node is proportional to its improvement value that corresponds to explained variance at the node. Overall misclassification rate of the optimal tree is 15.8% compared to 50% for the null model, with 16.7% misclassified success and 14.8% failure cases. Sensitivity (true positive rate, defined as the ability of the model to predict that a case is eradicated when it actually is) is 83.3 and specificity (true negative rate, defined as the ability of the model to predict that a case is not eradicated when it is not) 85.2% for learning samples, i.e. the samples not used to build the models for assessment of cross-validation errors, and 77.1 and 69.0%, respectively, for cross-validated samples, i.e. the best estimates that would occur if the models were to be applied to new data, assuming that the new data were drawn from the same distribution as the learning data.

