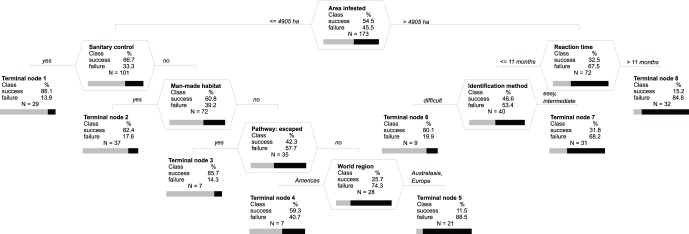
Figure 3. Optimal classification tree with event-specific factors placed at the top of the tree.
Otherwise as in Fig. 1. Overall misclassification rate of the optimal tree is 18.0% with 15.3% misclassified success and 23.4% failure cases. Sensitivity and specificity are respectively 84.7 and 76.6% for learning, and 66.7 and 64.9% for cross-validated samples. Detail explanation of misclassification rates, sensitivity and specificity is in Fig. 1.

