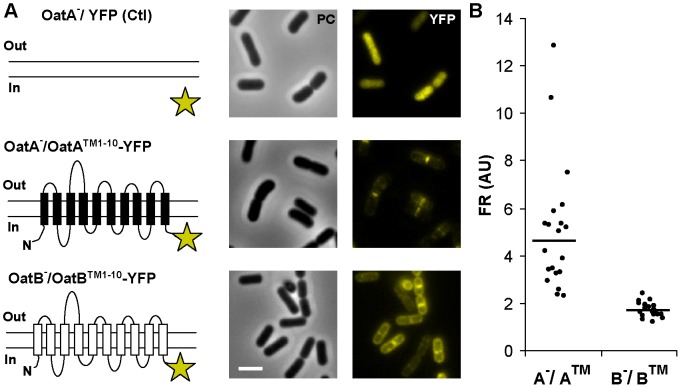
Figure 3. Subcellular localization of OatATM10-YFP and OatBTM10-YFP fusions.
A) Schematic representation of fusion proteins (YFP, yellow star) and corresponding micrographs in phase contrast (PC) microscopy and fluorescence microscopy (YFP). Upper panels, oatA mutant producing cytoplasmic YFP (OatA−/YFP) used as control; middle panels, oatA mutant producing OatATM1–10-YFP (OatA−/OatATM1–10-YFP); lower panels, oatB mutant producing OatBTM1–10-YFP (OatB−/OatBTM1–10-YFP). Induction of expression was performed with 10 ng/ml of nisin. Bar scale, 2.0 µm. B) Fluorescence ratio (FR; AU, arbitrary unit) between the fluorescence measured at mid-cell position and pole. A−/A™, oatA mutant producing OatATM1–10-YFP and B−/B™, oatB mutant producing OatBTM1–10-YFP. Lines represent the mean value (n = 20, 3 independent replicates).

