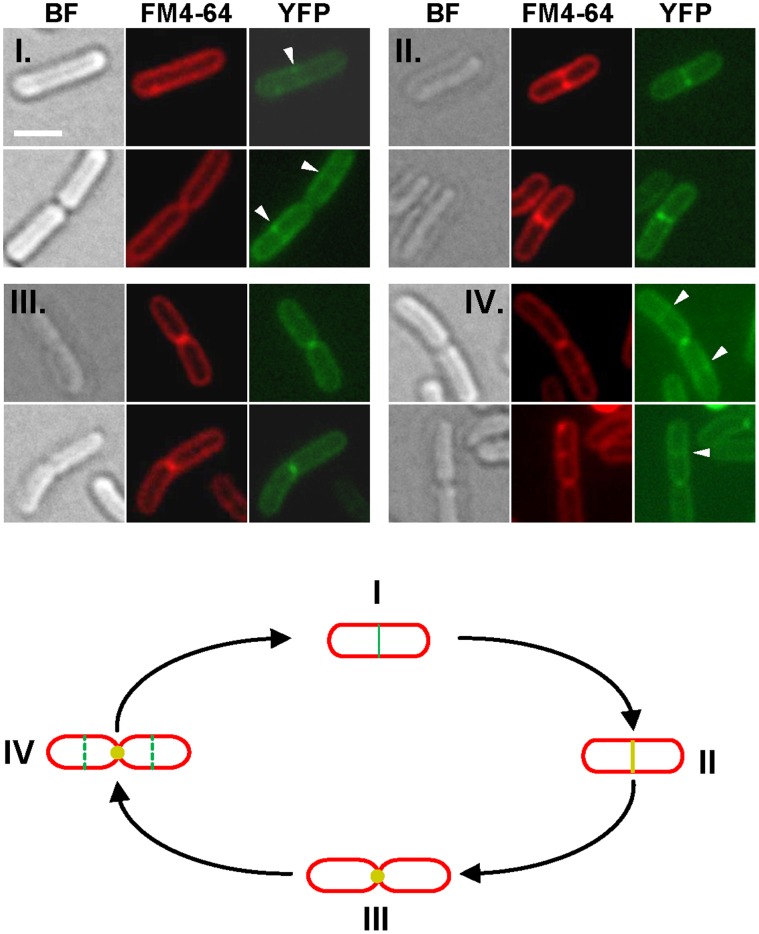
Figure 4. Temporal localization of OatATM1–10-YFP during the cell cycle.
Upper panels, selection of cells at different division stages observed in bright field (BF) microscopy and fluorescent microscopy (FM4–64, membrane staining; YFP, OatATM1–10-YFP fluorescence). Induction of oatATM1–10::yfp expression was performed with 10 ng/ml of nisin. I, septal localization of the YFP fusion prior to membrane invagination; II, co-localization of the YFP fusion and the septal membrane; III, polar localization at the end of septation; IV, reinitiation of septal localization in daughter cells. Bar scale, 1.0 µm. Lower panel, schematic representation of the cell cycle. Colors and numbers refer to above micrographs. Yellow represent a merge between FM4–64 and YFP fluorescences.

