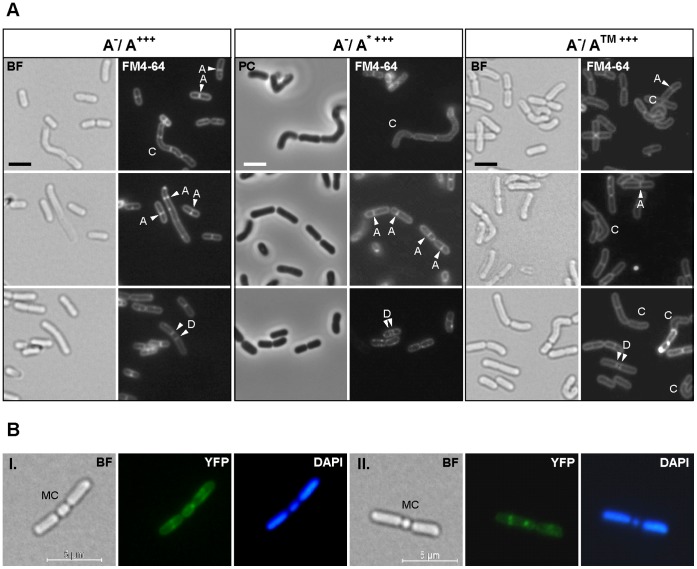
Figure 5. Morphological aberrations induced by the overproduction of different variants of OatA in the oatA mutant.
Induction was performed with 20 ng/ml of nisin. A) Selection of cells showing curvature (labeled C), asymmetrical septation (labeled A), dual septation (labeled D) observed in bright field (BF) or phase contrast (PC) microscopy and fluorescent microscopy (FM4–64, membrane staining). A−/A+++, oatA mutant overexpressing oatA WT; A−/A* +++, oatA mutant overexpressing oatA D510A/S511A; A−/A™ +++, oatA mutant overexpressing oatA TM1–10 ::yfp. Bar scale, 2.0 µm. B) Selection of two tripartite cells (I and II) showing a central mini-cell (labeled MC) resulting from a dual septation event observed in bright field (BF) microscopy and fluorescent microscopy (YFP, OatATM1–10-YFP fluorescence; DAPI, DNA staining).

