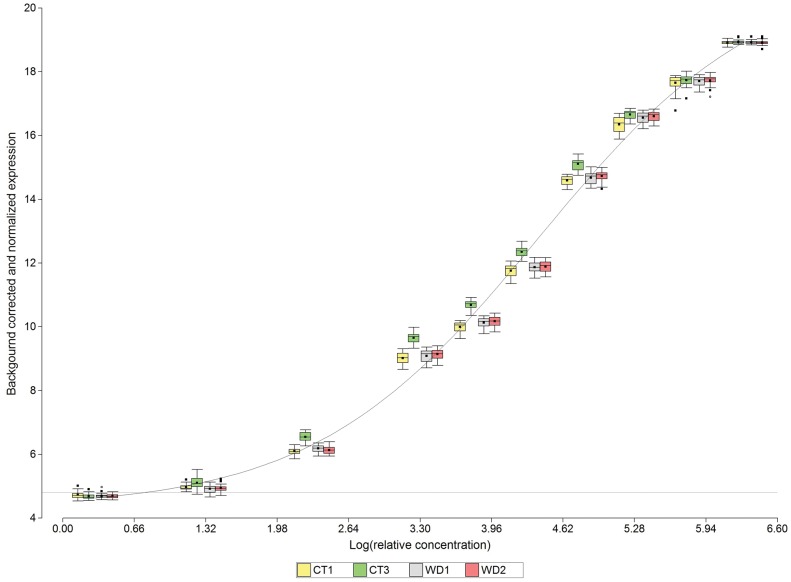
Figure 2. Normalized expression for RNA Spike-in control samples.
The logistic curve was fitted for the average of all treatments and replicates including a baseline at 4.7 units in the Y-axis scale. This baseline corresponds to the 5% lowest percentile of the expression signal distributions for RNA-Log (relative concentration) of 1.3. Box-plots of observed gene expression signals of technical replicates within each biological replicate, at different relative RNA concentrations in log scale, are represented.

