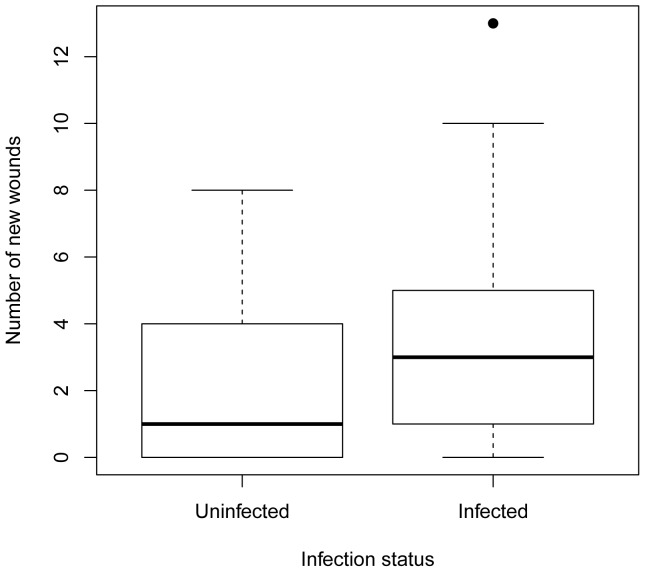
Figure 4. Median number of new wounds per individual deermouse by infection status.
Thick horizontal line is the median; top and bottom of boxes represent the 25 and 75 percentile, respectively; horizontal lines at ends of dashed lines represent the minimum and maximum values, excluding one outlier (black dot). The infected category includes all donor and TE deermice from all 4 experiments. The uninfected category includes all susceptible deermice that never seroconverted. Each deermouse is represented only once in the analyses.

