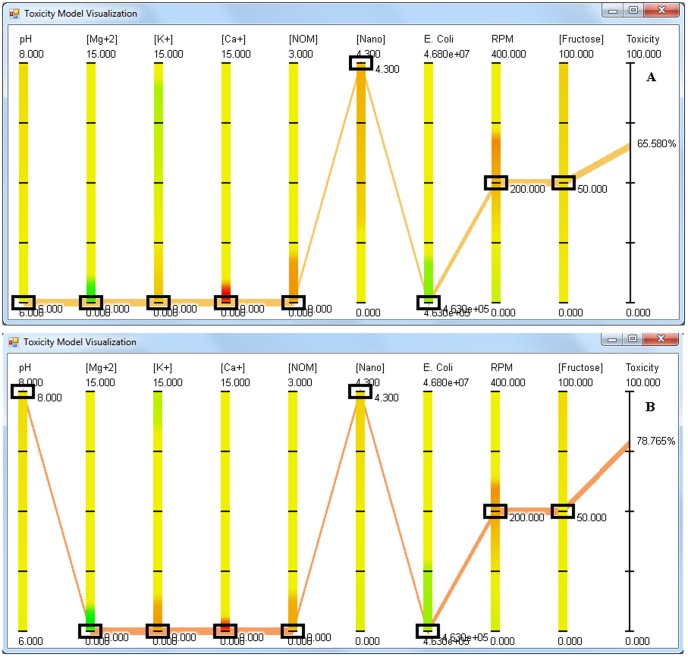
Figure 6. Screen shot of the visualization application showing the anti-bacterial activity of CeO2 NPs at a) pH 6 and b) pH 8.
The concentration of cations and NOM is set to 0, NPs and E. coli are at 4.3 ppm and 4.63×10⁵ CFU/mL respectively whereas RPM and fructose are set at 200 RPM and 50 ppm respectively.

