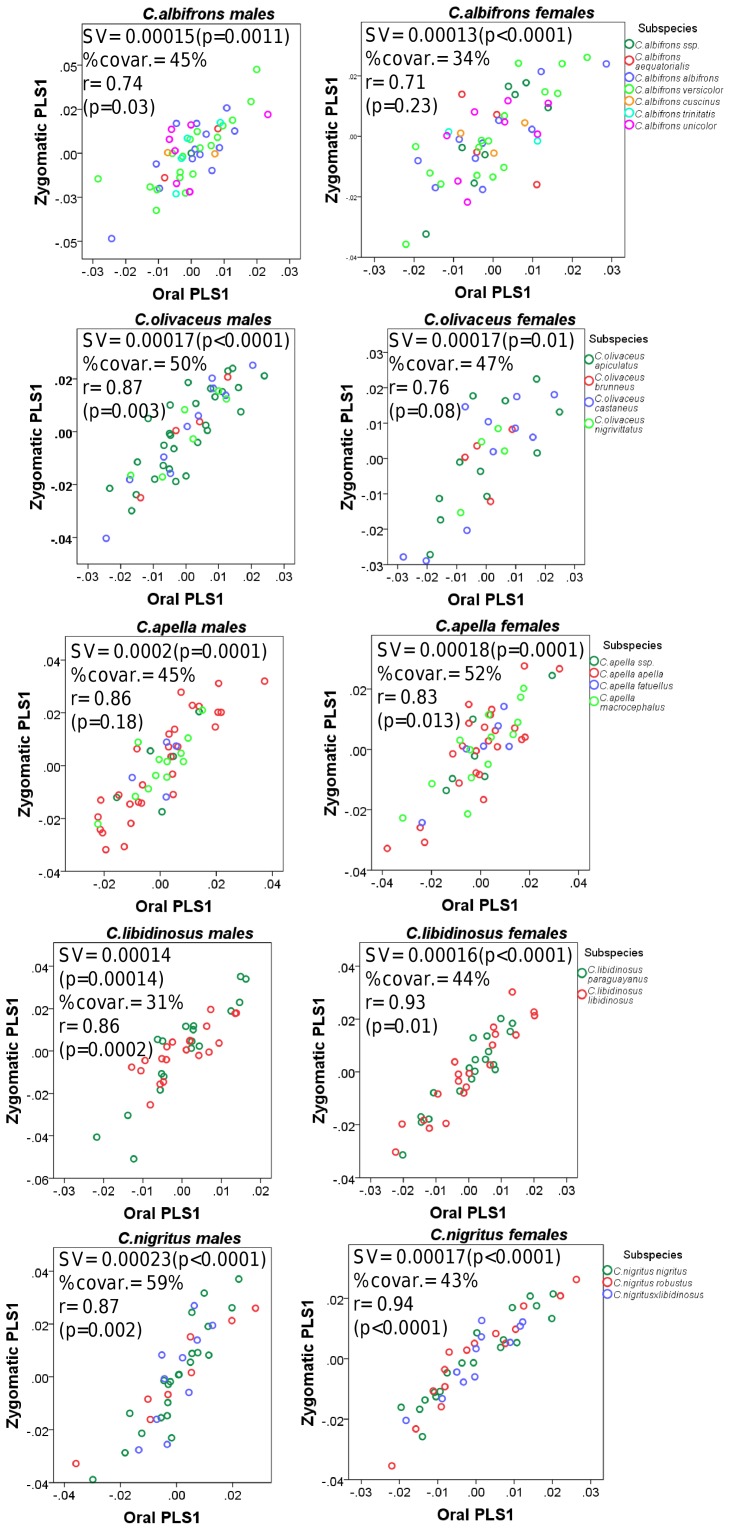
Figure 15. Differences in between-block association between males and females.
Distribution of the individuals’ loadings along the PLS1 axis of each block under an non-allometric oral-zygomatic PLS. Abbreviations : SV = singular value, %covar. = percentage of between-block total squared covariance explained by the set of PLS1 axes, r = between-block correlation coefficient.

