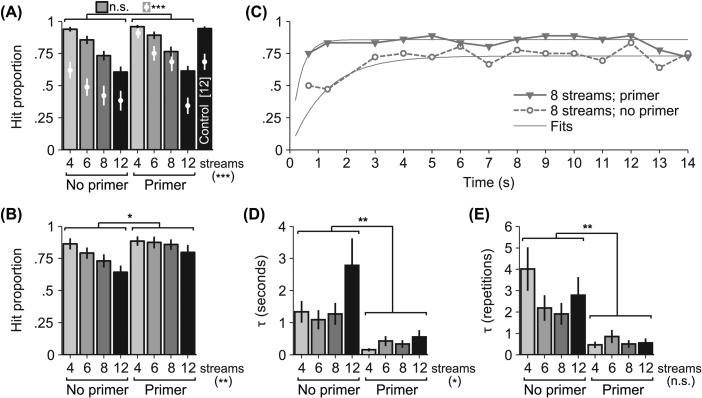
Figure 2.
Behavioral results. (A) The steady-state performance (bars) and first-repetition performance (white dots) for the first experiment (cross-subject mean ± SEM). (B) Steady-state performance for Experiment 2. (C) Example data (markers) from Experiment 2 and their exponential fits (solid, thin curves). Triangles with a solid line show performance on eight streams with primer, and circles with a dashed line show eight streams without a primer. (D) Time constant in terms of absolute time (seconds) for each condition (cross-subject mean ± SEM). (E) Time constants in terms of repetitions plotted as in (D).

