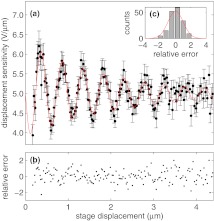
Figure 6.
Displacement sensitivity (β) versus stage displacement, and evaluation of Eq. 10 as fit using values from Table 1. (a) Determined β for a range of depths with errors, as described in text. Fit given by Eq. 10 shown in red. (b) Relative error between fit and determined κ shows no trend. (c) Histogram of relative errors shown in (B) are Gaussian distributed, implying a satisfactory fit.

