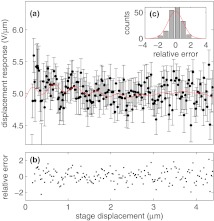
Figure 8.
Displacement response (ζ) versus stage displacement described in text, and evaluation of Eq. 16 with values ABG, λ, L, k, and ϕBG determined from fitting Figs. 26, given in Table 1, using Eq. 16 with β determined by Eq. 10. (a) Determined ζ for a range of depths with errors, as described in text. Fit given by Eq. 10 shown in red. The black dots use the experimental values of β. (b) Relative error between fit and determined ζ shows no trend. (c) Histogram of relative errors shown in (b) are Gaussian distributed, implying a satisfactory fit.

