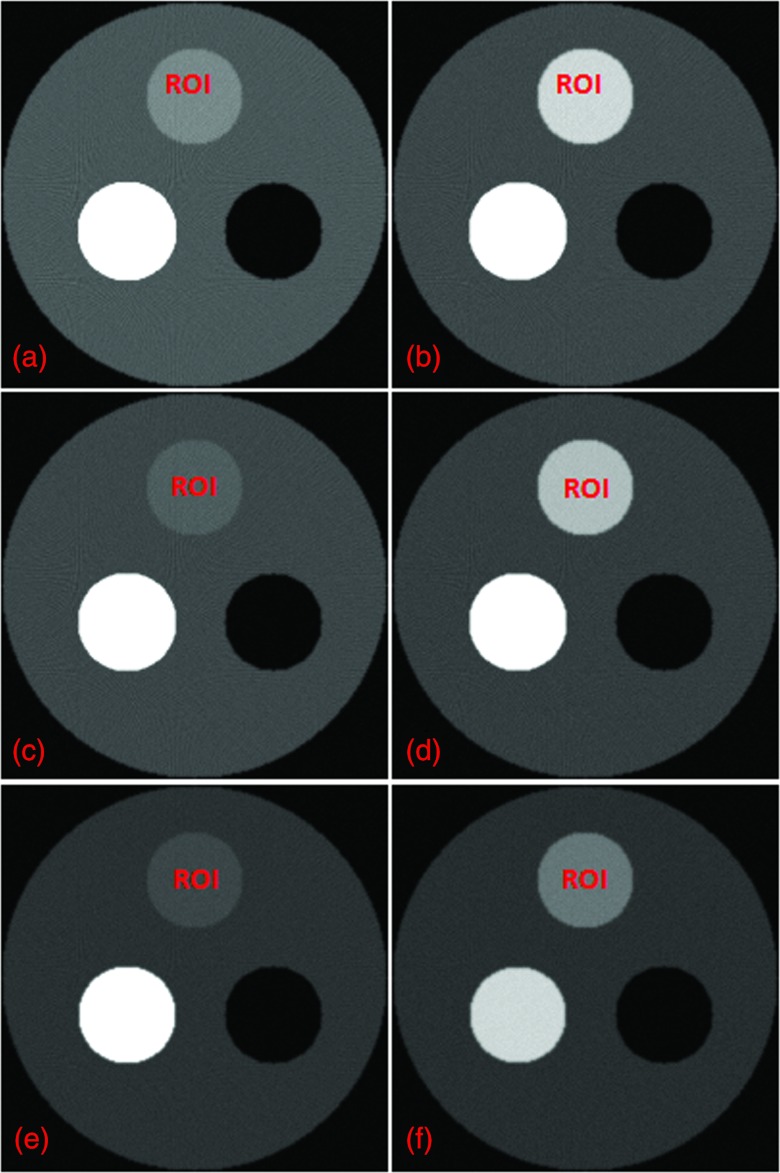
Figure 5.
K-edge imaging results with the maximum SDNR values for the target regions. (a) and (b) The reconstructed images on both sides of the iodine solution (0.9%) K-edge, (c) and (d) the reconstructed images on both sides of the barium solution (1.5%) K-edge, and (e) and (f) the reconstruction images on both sides of the gadolinium solution (0.5%) K-edge. The left column images are reconstructed on the left side of the contrast agent K-edge, and the right column images are on the right side of the K-edge. The display window for all the images is [0, 1].

