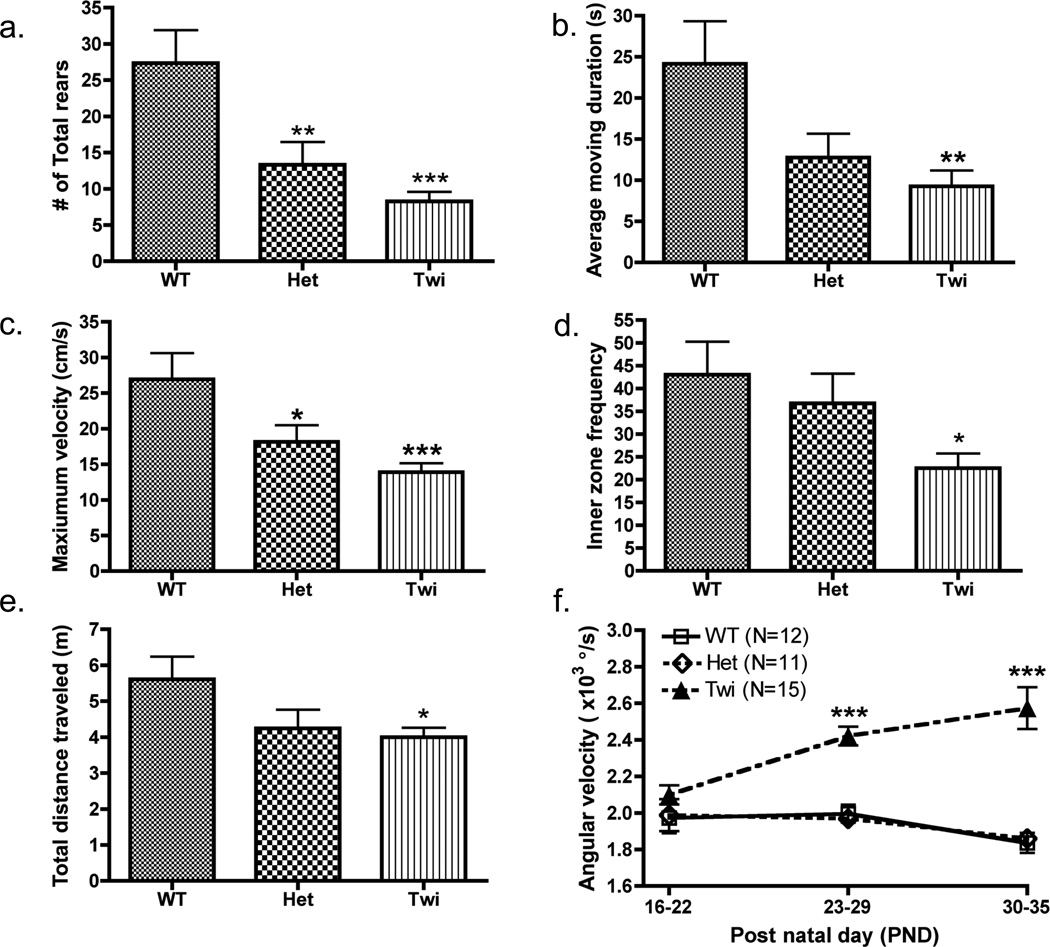
Figure 2. Assessment of behavioral and physiological differences in mice of different genotypes.
(a) The number of protected rears was manually observed for all untreated GLD mouse groups (WT (N=9), Het (N=13), and Twi (N=18)). Computer-automated values were generated using EthoVision XT7 software for (b) average moving duration (c) maximum velocity, (d) inner zone frequency, and (e) total distance traveled; all mice (WT (N=12), Het (N=13), and Twi (N=19)) were observed only once during the period of PND16–22. (f) Angular velocity was monitored for a select few mice from each group (WT (N=12), Het (N=11), and Twi (N=15)) over three consecutive weeks (PND 16–22, 23–29, and 30–35). Comparisons between the three genotype groups were made by Bonferroni’s posthoc testing following one-way ANOVA (a–e) or two-way ANOVA with repeated measures (f). Significant differences are denoted by *P<0.05, **P<0.01 and ***P<0.001 vs. WT mice.

