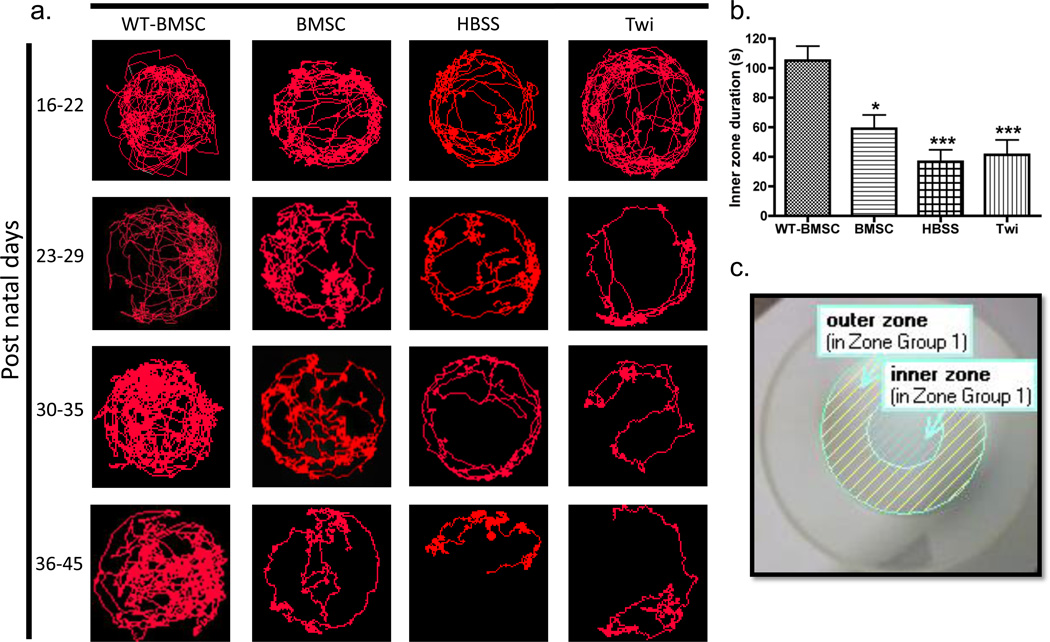
Figure 4. Monitoring disease progression by comparison of track visualizations.
(a) Representative images of sixteen mouse tracks are shown. These tracks were chosen as previously described for each of the four mouse groups over four consecutive weeks, PND16–22, 23–29, 30–35, and 36–45. For any given time period, a mouse was recorded once for 5 min, and Ethovision XT7 was used to generate the visualization of the mouse tracks. The HBSS-injected (HBSS) and untreated (Twi) twitcher tracks show a marked decrease in track density, especially in the inner zone of the arena, seen as early as PND 23–29. (b) The duration of time spent in the inner zone over 5 min (i.e., inner zone duration) was compared for BMSC-treated twitcher (BMSC, N=13), HBSS-injected mice (HBSS, N=19), non-injected twitcher (Twi, N=19), and BMSC-treated WT (WT-BMSC, N=15) mice. Comparisons between mouse groups were made using one-way ANOVA and Bonferroni’s post-hoc testing, where *P<0.05; **P<0.01; ***P<0.001 vs. WTBMSC. (c) A representative arena setting using EthoVision XT7 is shown with designated inner and outer zones for assessing thigmotaxis.

