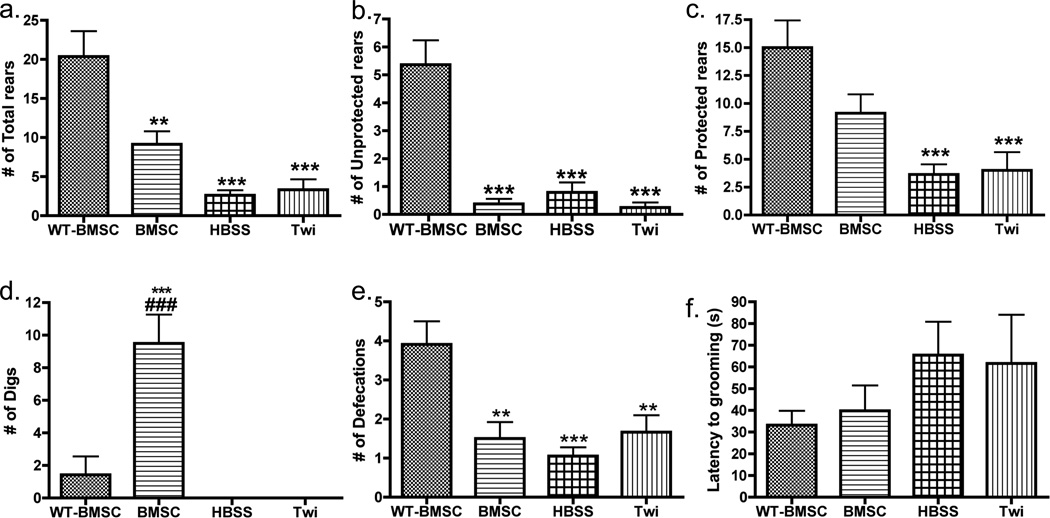
Figure 5. Behavioral differences between genotype and treatment groups detected by manual observation.
Comparative analysis of (a) the number of total rearing episodes, (b) the number of protected rearing episodes, (c) the number of unprotected rearing episodes, (d) the number of digs manually observed, (e) the number of defecations, and (f) the latency to grooming activity for four mouse groups (BMSC-treated twitcher (BMSC, N=13), HBSS-injected twitcher (HBSS, N=19), untreated twitcher (Twi, N=12) and BMSC-treated WT (WT-BMSC, N=11) mice). All mice were observed only once during the period of PND23–29, and comparisons between genotype were made using one-way ANOVA and Bonferroni’s post-hoc testing. Significant differences are denoted by *P<0.05; **P<0.01; ***P<0.001 vs. WT-BMSC mice and ###p<0.001 vs. Twi.

