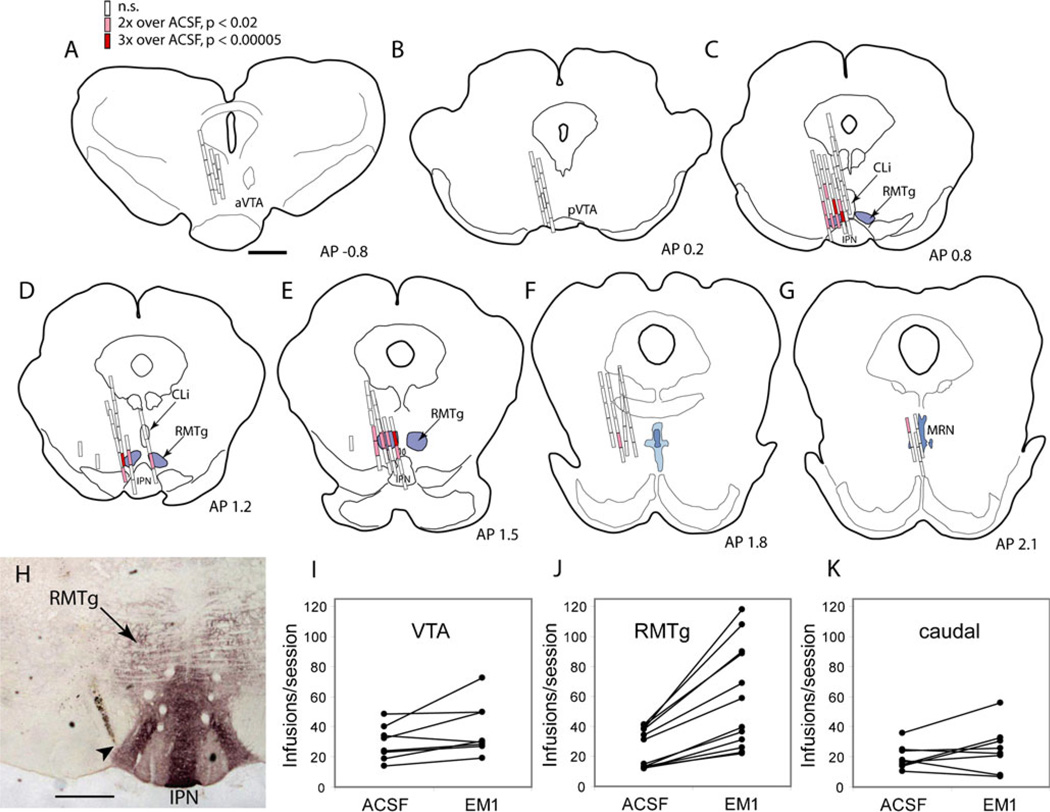
Fig. 1.
EM1 self-administration data for individual animals and sessions. a–g Individual ICSA infusion sites are shown in coronal sections arranged from rostral to caudal. Open rectangles represent sites where infusion rates for endomorphin-1 (EM1) were not higher than ACSF (p>0.02). Lighter filled rectangles indicate sites where EM1 infusion rates were two to three times ACSF rates (p<0.02), while darker filled rectangles indicate infusion rates greater than three times ACSF rates (p<0.00005). Concentric dashed rings outline areas within 0.5, 1.0, and 1.5 mm radius of RMTg center. h Coronal brain section shows MOR immunoreactivity (dark reaction product), which demarcates the RMTg; immunoreactivity is also elevated in the adjacent interpeduncular nucleus (IPN). Cannula tip just lateral to RMTg is indicated by arrowhead. Leverpressing rates for ACSF or EM1 in individual rats with cannulae in the VTA (i), within 0.5 mm of the RMTg center (j), or at sites caudal to the RMTg (k). Scale bars=1 mm (a–g) or 0.5 mm (h). aVTA anterior ventral tegmental area, pVTA posterior ventral tegmental area

