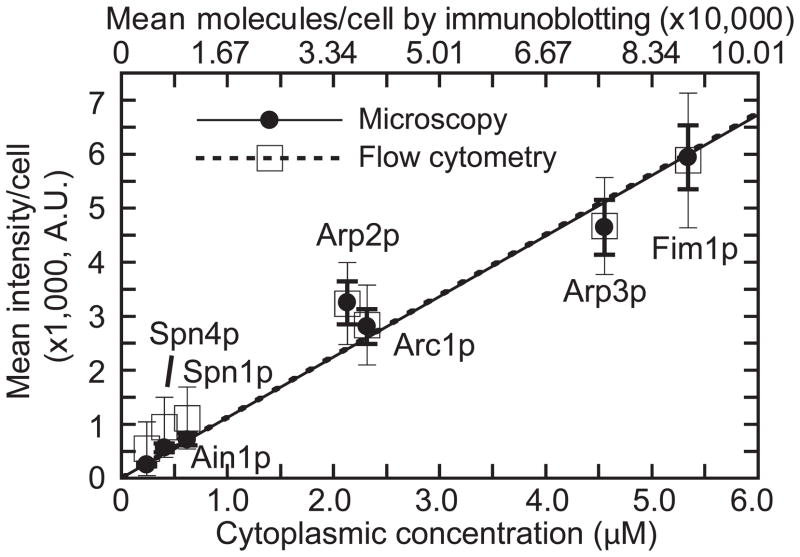
Figure 3.
Standard curve for counting protein molecules. Mean numbers of mYFP-tagged protein molecules per cell and cellular concentrations, both from immunoblotting, correlate linearly with cell-size corrected mean fluorescence intensity per cell from microscopy (solid line and filled circles) and flow cytometry (dashed line and open squares). The fission yeast cytokinesis proteins shown are small to medium sized (377–621 amino acids) and cover a range of cellular concentrations (0.22–5.34 μM). Ain1: α-actinin-like actin crosslinking protein; Spn1 and Spn4: septin GTPases; Arc1, Arp2, and Arp3: subunits of the actin filament-nucleating Arp2/3 complex; and Fim1: actin crosslinker fimbrin. From Wu and Pollard, Science, 2005. Reprinted with permission from AAAS.

