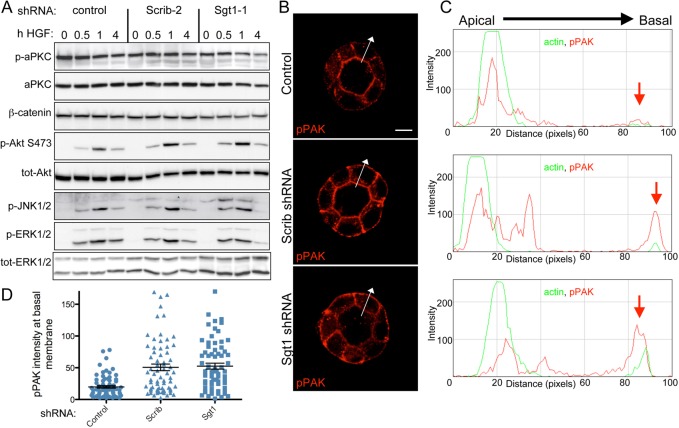
Fig. 6.
RNAi of Scrib or Sgt1 leads to mislocalization of pPAK (T423). (A) Total cell lysates were harvested from MDCK cysts following treatment with HGF for the indicated times (in hours). Lysates were then run on SDS-PAGE gels and subjected to western blot analysis for the indicated proteins. (B) Immunofluorescence staining of MDCK control shRNA or Scrib and Sgt1 shRNA cysts with an antibody that recognizes phosphorylation of Pak1/2 at position Thr423/402 (red). Arrows are drawn through cyst walls at the location where images were subjected to linescan analysis. (C) Linescan analysis using ImageJ software to plot the intensity of actin staining (green line) and pPAK staining (red line) along the apico-basal axis of a cell in the cyst wall shown by arrows in B. Red arrow indicates the location of the basal membrane of cells. The signal intensity peak for actin identifies the apical surface of individual cells in the cyst. (D) Intensity of pPAK staining at the basal surface was quantified using linescans through numerous cysts and plotting as a scatter plot. Scale bar: 10 µm.

