Fig. 1.

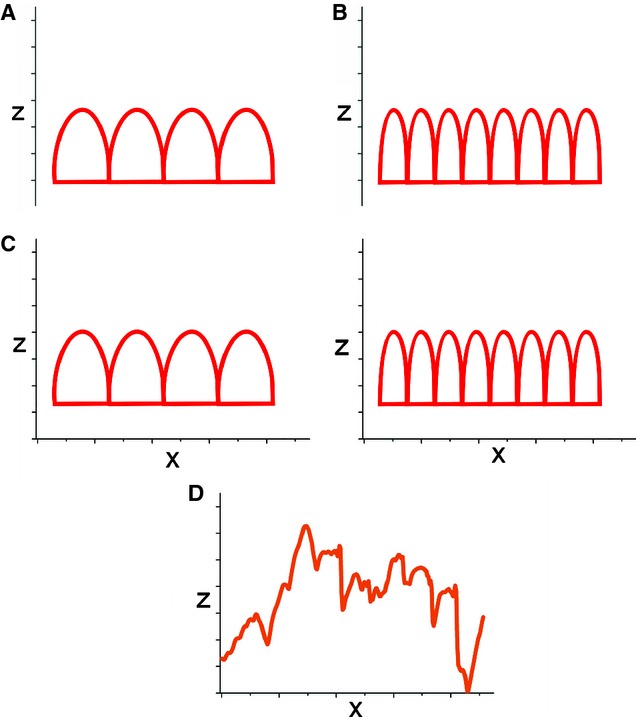
Roughness analysis. (A,B) Examples of ideally regular surface profiles showing ‘peaks and valleys’ (2D profiles are shown for simplicity). Measures of roughness only consider the vertical (z-axis) deviation from the mean surface and therefore cannot distinguish between A and B profiles that display the same roughness. However, the profiles A and B actually differ considerably, since B has more peaks and those peaks are narrower. (C) In contrast, PSD analysis considers not only vertical deviation, but also the width (x-axis) of surface peaks (∼wavelength), i.e. their number per unit length (spatial frequency = inverse wavelength). (D) A real example of a complex profile of bone surface. PSD is based on Fourier transformations which decompose the complicated wave to a number of ideal waves of particular wavelengths. For characterization of any surface, it is useful to know the vertical deviation of the peaks from the mean surface, but also the size of those elements (peaks), as well as their relative contribution (power) to overall surface topography (see Fig. 3).
