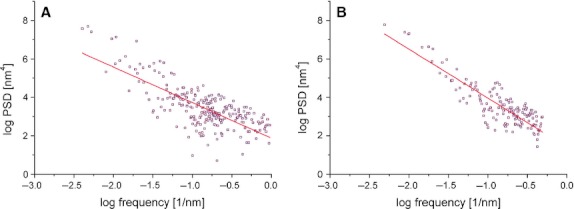
Fig. 3.

Power spectral density graph with linear fitting in a young female (A) and an elderly female individual (B). Note that both axes are with a logarithmic scale. Y-values (PSD, power spectral density) correspond to the contribution of particular spatial frequency X-value to overall image.
