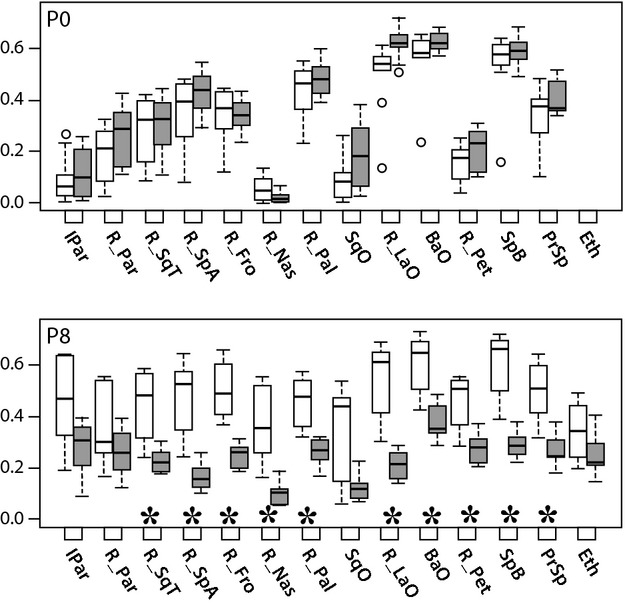
Fig. 5.

Relative bone mineral density (MH/T Ratios). Boxplots of rBMD, quantified by the MH/T volume ratio, of Fgfr2+/Y394C mutants (gray bars) and unaffected littermates (white bars). Bone element abbreviations found in Fig. 4. Outliers (circles) are data points that exist more than 1.5 times the interquartile range from the box. *Significant differences in two-sample t-tests of MH/T bone volume ratios between mutant mice and unaffected littermates.
