
Fig. 6.
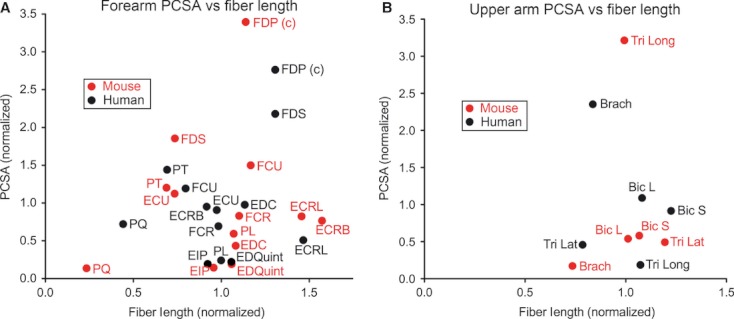
Plot of PCSA vs. fiber length for the distal (A) and proximal forelimb muscles (B) of the human and mouse. Data for each species have been normalized to the average of all muscles of that species on the graph (distal normalized to distal muscles and proximal to proximal). A (c) after a muscle name indicates that it is the combined value of all heads of the muscle. Human data were obtained from previously published values.(Lieber et al. 1990, 1992; Murray et al. 2000).