Fig. 1.

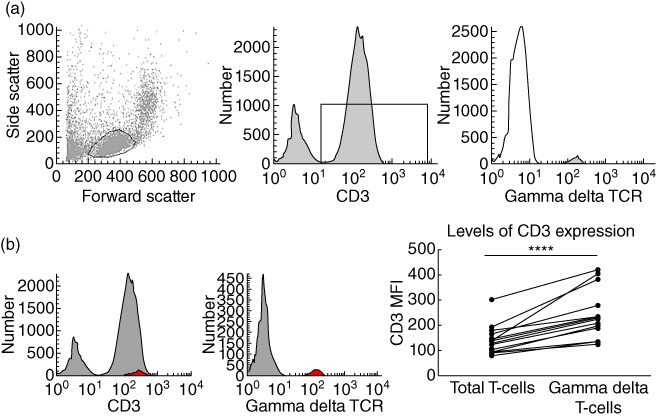
Identification of human circulating γδ T cells and levels of CD3 expression. (a) Identification of γδ T cells from peripheral blood mononuclear cells (PBMC) according to fluorescence activated cell sorter (FACS) plots of forward- and side-scatters, and subsequent CD3 histogram and γδ T cell receptor (TCR) histogram. This example is from a healthy control. γδ T cells comprised 5·2 ± 0·9% (n = 27) of the total circulating T cell population. (b) FACS histograms demonstrating γδ T cells (red) back-gated onto the CD3 peak using WinList™ software, and summary graphs demonstrating mean fluorescence intensity (MFI) of CD3 staining of total circulating T cells compared with γδ T cells (n = 27). Histograms are representative of 27 independent experiments and were compared to isotype-matched controls. Paired t-test was applied. A P-value < 0·05 was considered statistically significant (*P < 0·05; **P < 0·01; ***P < 0·001).
