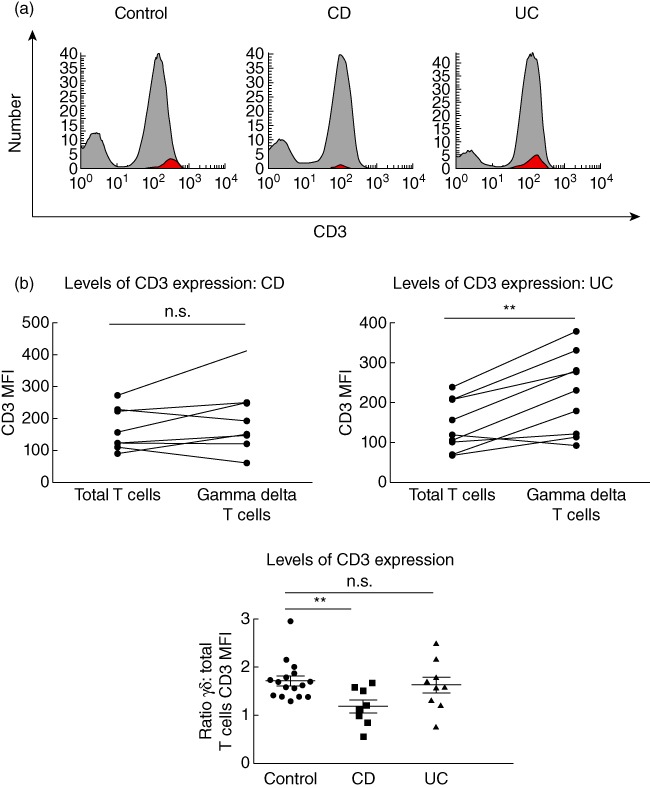
Fig. 3.

Reduced CD3 levels on γδ T cells in Crohn's disease but not ulcerative colitis. (a) Fluorescence activated cell sorter (FACS) histograms demonstrating levels of CD3 expression via γδ T cells (red) back-gated onto the CD3 peak using WinList™ software in healthy controls, active Crohn's disease (CD) patients and active ulcerative colitis (UC) patients. Histograms are representative of several independent experiments. (b) Summary graphs demonstrating mean fluorescence intensity (MFI) of CD3 staining of total circulating T cells compared with γδ T cells in active CD patients (n = 8) and active UC patients (n = 9), and summary graph demonstrating ratio of γδ T cell CD3 mean fluorescence intensity (MFI): total T cells CD3 MFI in healthy controls (1·6 ± 0·1, n = 16), active CD (1·2 ± 0·1, n = 8) and active UC (1·6 ± 0·2, n = 9). For comparison of total T cells versusγδ T cells CD3 MFI within the same individuals, paired t-tests were applied. For comparison of γδ T cell : total T cell CD3 MFI ratios between healthy controls, active CD and active UC patients, unpaired t-tests were applied. A P-value < 0·05 was considered statistically significant (*P < 0·05; **P < 0·01; ***P < 0·001; ***P < 0·001). Error bars represent standard error of the mean, horizontal line represents the mean.
