
Fig. 1.
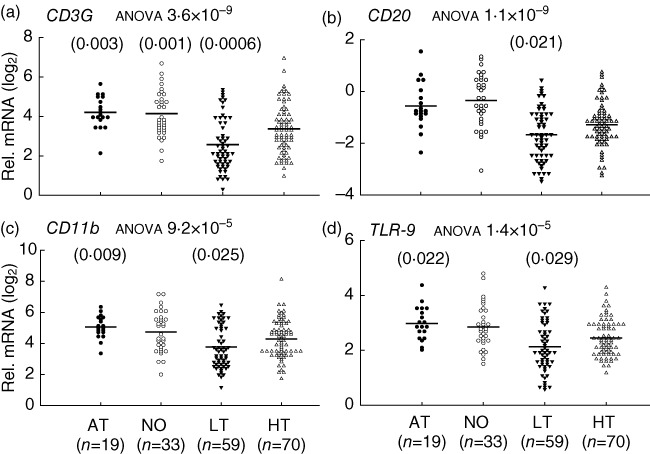
Innate and adaptive gene expression insufficiencies in long-term (LT), but not new-onset (NO) and at-risk (AT), type 1 diabetes (T1D) patients, compared to healthy (HT) controls. Relative mRNA expression levels are calculated as fold change against a common control and plotted in a log2 scale. The line indicates the average value in a group. The P-value from analysis of variance (anova) for each gene is indicated after the title of each plot. The P-value for comparison between a T1D group and healthy controls is presented on top of the gene expression value plots if it was less than 0·05 in both regression analyses with age adjustment, and Student's t-test without age adjustment. Shown is the higher (more nullifying) P-value from the regression analyses or Student's t-tests. Cut-off P-values for the t-test and regression analysis are 0·026 and 0·029, respectively, determined with the Benjamini–Hochberg procedure at a false discovery rate (FDR) <0·05 for a family of 13 hypothesis tests (13 genes). However, P-values less than 0·05 but above 0·026 or 0·029 are still presented to shown potential marginal significance.