
Fig. 3.
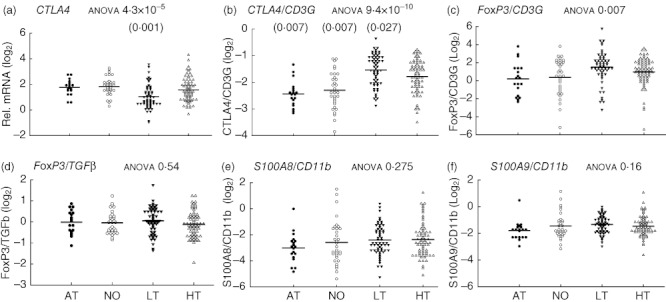
Dynamics and equilibrium of innate and adaptive regulatory gene expression ratios in type 1 diabetes (T1D) patients at different stages of the disease. Relative mRNA levels, or the expression ratios of two genes, are plotted in a log2 scale. The line indicates the average value in a group. The P-value from analysis of variance (anova) for each gene expression value or ratio is indicated after the title of each plot. The P-value for comparison between a T1D group and healthy controls is presented according to the same description in Fig. 2. (a) Cytotoxic T lymphocyte-associated antigen 4 (CTLA4) expression levels in healthy and T1D subjects. (b–f) Gene expression ratios of CTLA4 versus CD3G, forkhead box protein 3 (FoxP3) versus CD3G, FoxP3 versus transforming growth factor (TGF)-β, S100A8 versus CD11b and S100A9 versus CD11b, respectively. Sample numbers are the same as in Fig. 2, except for (c) and (d), LT (n = 55) and HT (n = 69).