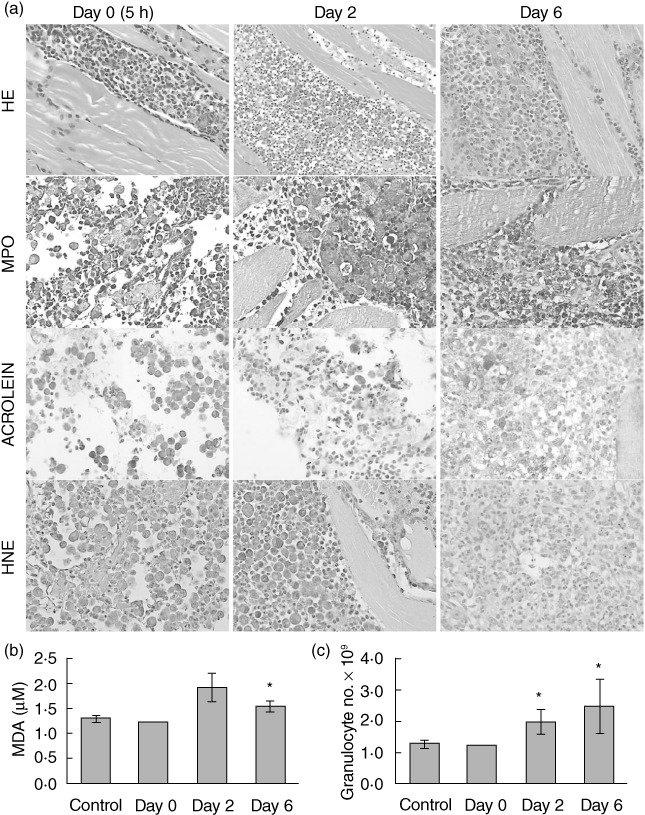
Fig. 5.

Lipid peroxidation (LPO) during tumour regression. (a) Tumour tissue samples stained with haematoxylin and eosin (H&E), myeloperoxidase (MPO), acrolein and 4-hydroxy-2-nonenal (HNE) on days 0 (5 h), 2 and 6 after tumour transplantation. (b) Changes in MDA concentration and (c) whole blood granulocyte number during tumour regression (mean ± standard error per group). Asterisks indicate statistically significant differences with respect to the values of healthy controls (P < 0·05).
