Figure 1.
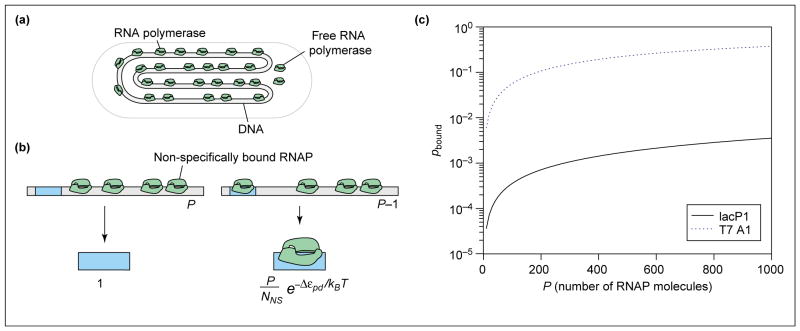
Probability of promoter occupancy (a) Schematic showing how, in the simple model, the DNA molecule serves as a reservoir for the RNAP molecules, almost all of which are bound to DNA. (b) Illustration of the states of the promoter – either with RNAP not bound or bound and the remaining polymerase molecules distributed among the non-specific sites. The statistical weights associated with these different states of promoter occupancy are also shown. (c) Probability of binding of RNAP to promoter as a function of the number of RNAP molecules for two different promoters. We assume the number of non-specific sites is NNS = 5 × 10⁶, and calculate the binding energy difference using the simple relation , where the equilibrium dissociation constants for specific binding ( ) and non-specific binding ( ) are taken from in vitro measurements. In particular, making the simplest assumption that the genomic background for RNAP is given only by the non-specific binding of RNAP with DNA, we take [37], for the lac promoter [38] and for the T7 promoter, [39]. For the lac promoter, this results in Δεpd = −2.9kBT and for the T7 promoter, Δεpd = −8.1kBT.

