
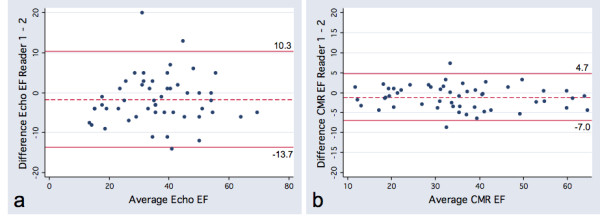
Figure 1.
Bland Altman plots for interobserver variability.a, Echocardiographic Ejection Fraction (Echo EF) and b, Cardiac Magnetic Resonance Ejection Fraction (CMR EF), with limits of agreement.
Official websites use .gov
A
.gov website belongs to an official
government organization in the United States.
Secure .gov websites use HTTPS
A lock (
) or https:// means you've safely
connected to the .gov website. Share sensitive
information only on official, secure websites.
Bland Altman plots for interobserver variability.a, Echocardiographic Ejection Fraction (Echo EF) and b, Cardiac Magnetic Resonance Ejection Fraction (CMR EF), with limits of agreement.