
Figure 3.
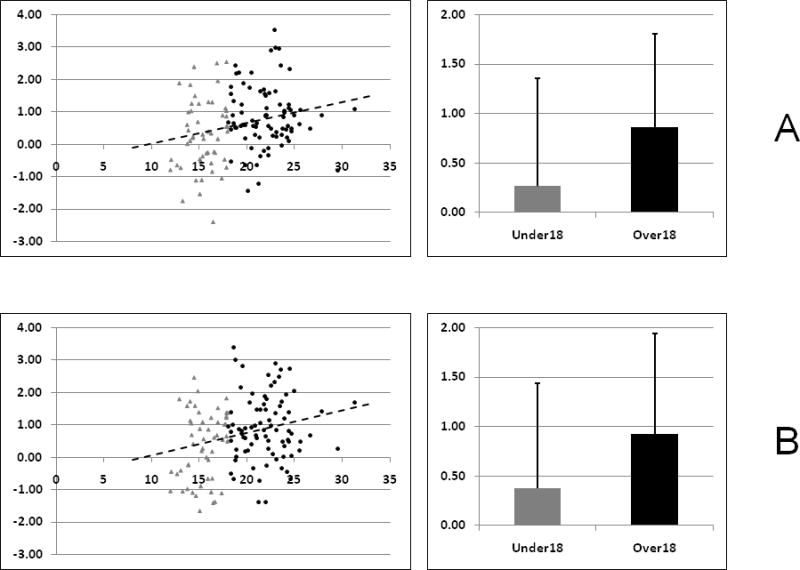
Graphical representations of the region-of-interest analysis results for the two regions showing significant age-related gains in neural activity from the high task-set inertia cortical control network (A. Left middle frontal gyrus, B. Left inferior parietal lobe). For purposes of display, the participants have been divided into those under the age of 18 (shown in GRAY TRIANGLES) and those over the age of 18 (shown in BLACK CIRCLES). The scatter plots on the left depict individual subject beta weights versus age, along with the best linear fit line. The bar plots on the right summarize the mean beta weights for the two age groups (GRAY: under 18; BLACK: over 18).