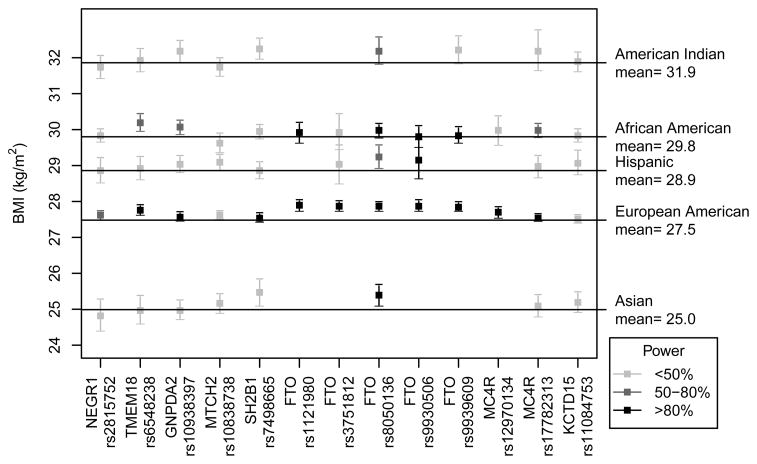
Figure 1. Interpretation of association results and statistical power.
Plot of per-allele difference and 95% confidence interval from the population mean BMI for each racial/ethnic group, and statistical power for each analysis. This plot is restricted to analyses that included at least 1000 subjects. All analyses used the BMI-increasing allele named in prior GWAS as the risk allele; thus estimates falling above the mean BMI line are in the same direction as prior GWAS. >Statistical power is indicated by color intensity, with light grey indicating <50% power, medium grey boxes indicating 50–80% power, and black boxes indicating >80% power.

