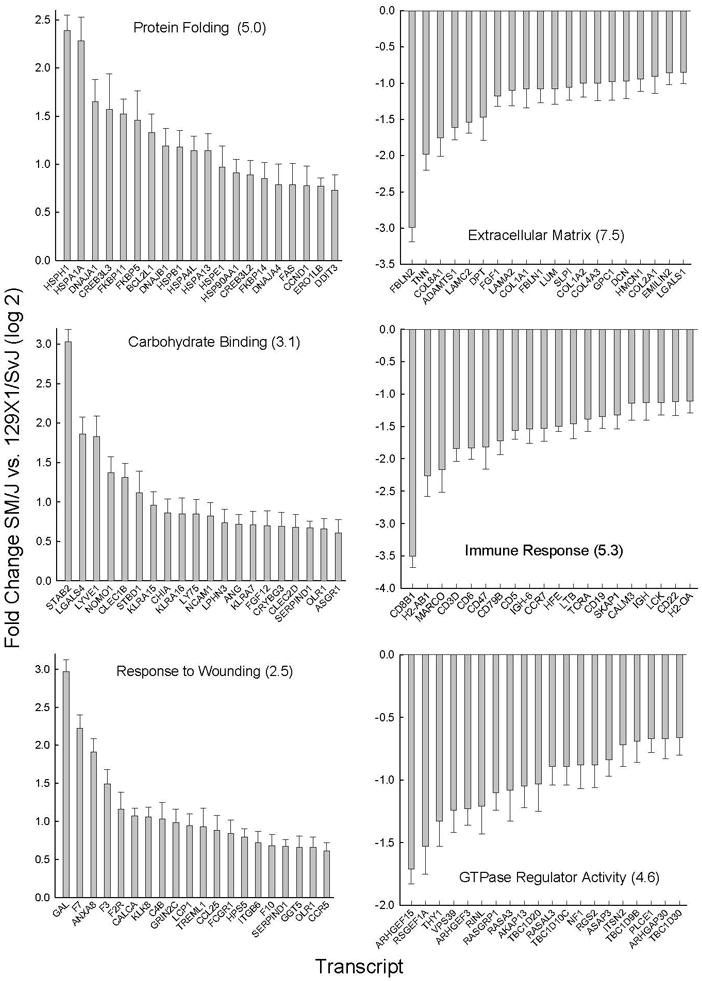
Figure 5. Metabolome pathways enriched in transcripts in sensitive (SM/J) as compared to resistant (129×1/SvJ) mouse lung.

Pathway enrichment was assessed by Database for Annotation, Visualization, and Integrated Discovery (DAVID) using significant (p <0.05 by ANOVA) increased (log 2 mean >0.58) or decreased (log 2 mean <−0.58) microarray transcript levels. The statistically enriched pathways gene ontogeny (GO) categories (−log P value in parenthesis) with (Left) increased transcripts included: (Top) protein folding, (Middle) carbohydrate binding, and (Bottom) response to wounding. Increased transcripts were increased more in SM/J as compared to 129×1/SvJ mouse strains. The statistically enriched pathways gene ontogeny (GO) categories (−log P value in parenthesis) with (Right) decreased transcripts included: (Top) extracellular matrix part, (Middle) immune response, and (Bottom) GTPase regulator activity. Bars: Transcripts with greatest difference between strain (log 2 mean ± SE, n=5 mice/strain, p<0.05). Abbreviations: Current Entrez gene symbols.
