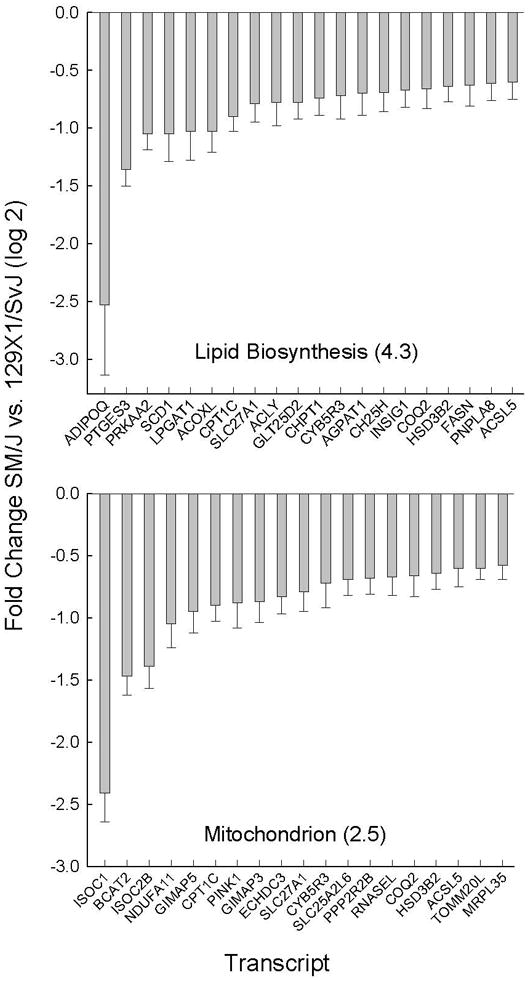
Figure 6. Decreased transcripts in lipid biosynthesis and mitochondrion gene ontogeny (GO) categories present in sensitive (SM/J) as compared to resistant (129×1/SvJ) mouse lung.

Pathway enrichment was assessed by Database for Annotation, Visualization, and Integrated Discovery (DAVID) using significant (p <0.05 by ANOVA) increased (log 2 mean >0.58) or decreased (log 2 mean <−0.58) microarray transcript levels. GO categories enrichment (−log P value in parenthesis). Bars are transcript levels with the greatest fold difference within each pathway are displayed (log 2 mean ± SE, n=5 mice/strain) that decreased in SM/J as compared to 129×1/SvJ mouse lung. Abbreviations: Current Entrez gene symbols.
