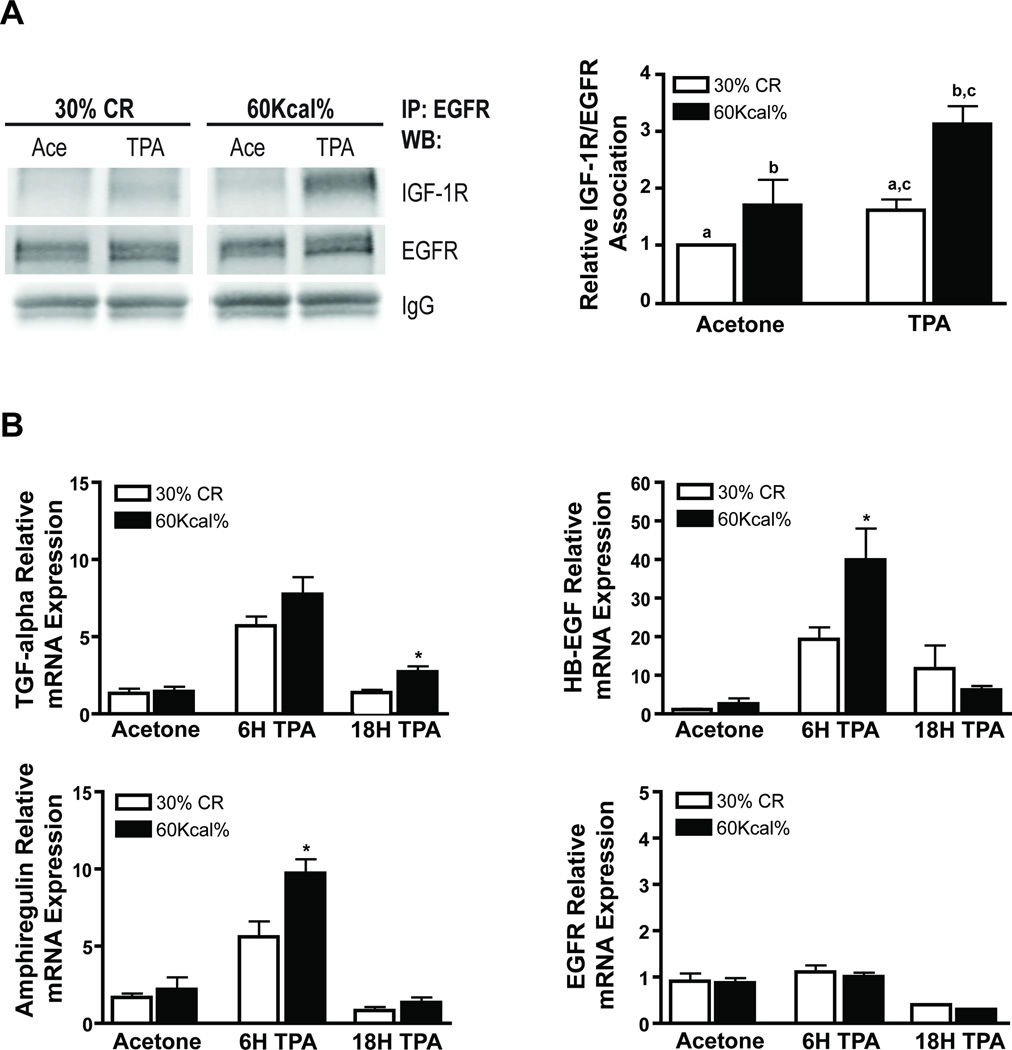
Figure 5.
Effect of dietary manipulation on IGF-1R/EGFR heterodimerization and EGFR and EGFR ligand mRNA expression. ICR female mice were maintained on a 30% CR (white bars) and 60Kcal% fat (black bars) diet and treated with TPA as described in Figure 2 (n=6). Epidermal lysates were pooled and prepared for co-immunoprecipitation experiments and qPCR analysis. A, Co-immunoprecipitation with EGFR and subsequent Western blot analyses for EGFR and IGF-1R (left panel); representative densitometry graph (right panel). EGFR and IGF-1R were normalized to IgG and then to each other. Data shown represents mean ± SEM of three independent experiments. a–c Values with the same lettering indicate statistically significant differences (p < 0.05, Student’s t-test). B, qPCR analysis of EGFR and the EGFR ligands TGF-α, HB-EGF, Amphiregulin, and EGFR. Data represents mean ± SEM. * Significantly different from 30% CR group at the corresponding time point (P < 0.05, Mann-Whitney U test).

