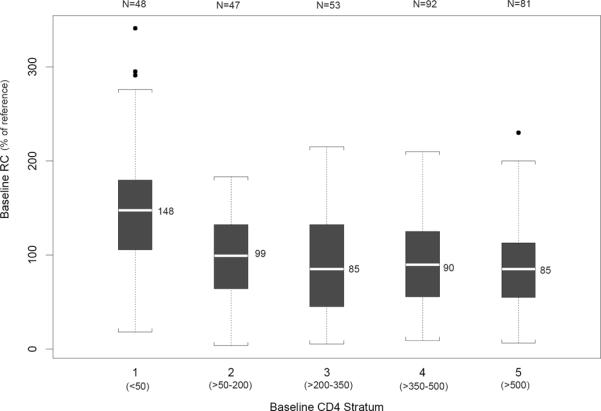
Figure 2. RCBL versus CD4BL Cell Count.

This box-and-whiskers plot illustrates the median RC value for each CD4 stratum (horizontal white line and adjacent value). The Q1 to Q3 (25th to 75th percentile) is depicted by the shaded box, the whiskers are drawn to the nearest value not beyond a standard span (1.5 × the interquartile range, defined as Q3 − Q1) from Q1 and Q3, and points beyond the whiskers (outliers) are drawn individually. RCBL was significantly greater in stratum 1 (CD4 <= 50) compared with the other 4 CD4 strata (p<0.0001).
