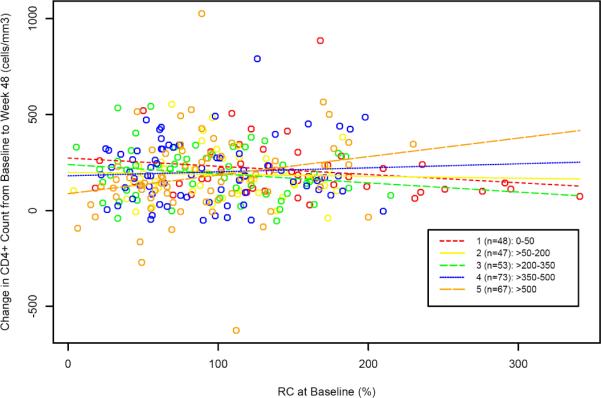
Figure 3A. ΔCD448 and RCBL by BL CD4 Stratum (restricted to subjects with virologic suppression at week 48).

Individual subjects are depicted by colored circles corresponding to the five BL CD4 strata. Each corresponding colored line represents the univariate least squares fit (ΔCD448 on RCBL) generated for each stratum. The lines are drawn beyond the individual points to illustrate the relationships among the lines.
